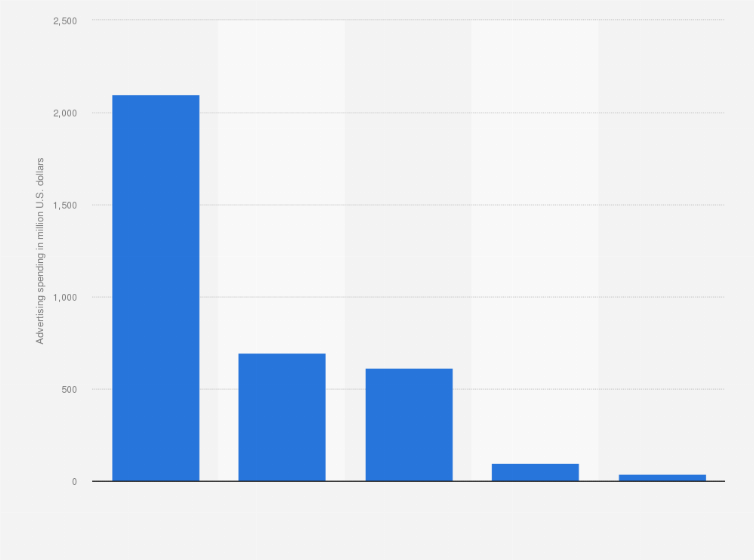
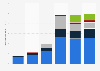
Political ad spending for the United States midterm elections amounted to over 3.5 billion U.S. dollars as of August 2022. Advertising spend on broadcast TV totaled around 2.1 billion U.S. dollars, the highest value among all media types. Nearly 700 million U.S. dollars were invested in digital ads, while cable TV received approximately 615 million U.S. dollars.
Political advertising spending in the United States midterm elections between January 1 and August 1, 2022, by media type
(in million U.S. dollars)
Adjust the presentation of the statistic and data points.
Share the statistic on social media channels or embed the statistic in your
website using "Embed Code", where available.
Cite this statistic and select one of the following formats: APA, Chicago, Harvard, MLA & Bluebook.
Print the statistic including description and metadata.
Chart type
Political advertising spending in the United States midterm elections between January 1 and August 1, 2022, by media type
Share this statistic
You have no right to use this feature.
Make sure to contact us if you are interested in scientific citation.
You can upgrade your account to enable this functionality for all statistics.
This feature is not available with your current account.Request access
Learn more about how Statista can support your business.
Axios. (August 2, 2022). Political advertising spending in the United States midterm elections between January 1 and August 1, 2022, by media type (in million U.S. dollars) [Graph]. In Statista. Retrieved May 13, 2025, from https://www.statista.com/statistics/1324465/us-political-ad-spending-by-media-type/
Axios. "Political advertising spending in the United States midterm elections between January 1 and August 1, 2022, by media type (in million U.S. dollars) ." Chart. August 2, 2022. Statista. Accessed May 13, 2025. https://www.statista.com/statistics/1324465/us-political-ad-spending-by-media-type/
Axios. (2022). Political advertising spending in the United States midterm elections between January 1 and August 1, 2022, by media type (in million U.S. dollars) . Statista. Statista Inc.. Accessed: May 13, 2025. https://www.statista.com/statistics/1324465/us-political-ad-spending-by-media-type/
Axios. "Political Advertising Spending in The United States Midterm Elections between January 1 and August 1, 2022, by Media Type (in Million U.S. Dollars) ." Statista, Statista Inc., 2 Aug 2022, https://www.statista.com/statistics/1324465/us-political-ad-spending-by-media-type/
Axios, Political advertising spending in the United States midterm elections between January 1 and August 1, 2022, by media type (in million U.S. dollars) Statista, https://www.statista.com/statistics/1324465/us-political-ad-spending-by-media-type/ (last visited May 13, 2025)
Political advertising spending in the United States midterm elections between January 1 and August 1, 2022, by media type (in million U.S. dollars) [Graph], Axios, August 2, 2022. [Online]. Available: https://www.statista.com/statistics/1324465/us-political-ad-spending-by-media-type/
Profit from additional features with an Employee Account
Please create an employee account to be able to mark statistics as favorites.
Then you can access your favorite statistics via the star in the header.
Profit from the additional features of your individual account
Currently, you are using a shared account. To use individual functions (e.g., mark statistics as favourites, set
statistic alerts) please log in with your personal account.
If you are an admin, please authenticate by logging in again.