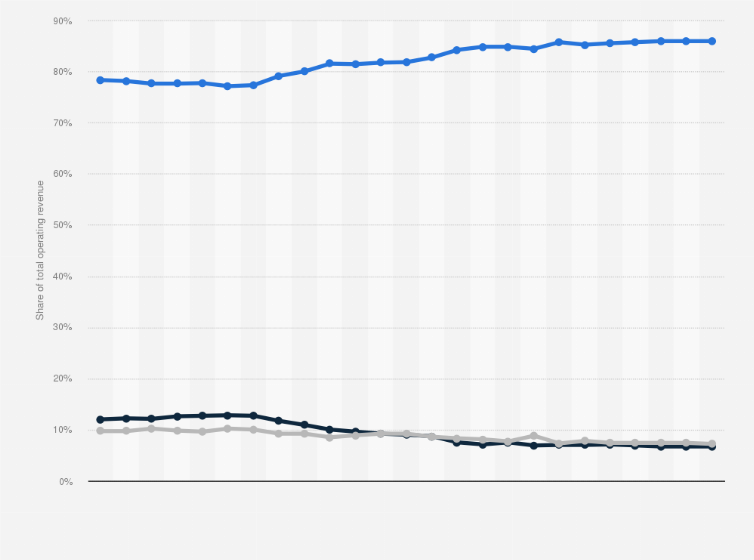
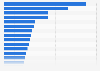
In the fiscal year of 2019, local government funds represented around 85.9 percent of all library operating revenues. This is an increase from 78 percent in 1995. However, the share of funds received from state governments decreased from 12 to seven percent in the same time period.
Advertisement
Advertisement
Distribution of public libraries operating revenue among sources in the United States from the fiscal year of 1995 to the fiscal year of 2019, as a share of total revenue
Adjust the presentation of the statistic and data points.
Share the statistic on social media channels or embed the statistic in your
website using "Embed Code", where available.
Cite this statistic and select one of the following formats: APA, Chicago, Harvard, MLA & Bluebook.
Print the statistic including description and metadata.
Chart type
Distribution of public libraries operating revenue among sources in the United States from the fiscal year of 1995 to the fiscal year of 2019, as a share of total revenue
Share this statistic
You have no right to use this feature.
Make sure to contact us if you are interested in scientific citation.
You can upgrade your account to enable this functionality for all statistics.
This feature is not available with your current account.Request access
Learn more about how Statista can support your business.
IMLS. (May 1, 2021). Distribution of public libraries operating revenue among sources in the United States from the fiscal year of 1995 to the fiscal year of 2019, as a share of total revenue [Graph]. In Statista. Retrieved June 21, 2025, from https://www.statista.com/statistics/1326622/us-public-libraries-operating-revenue-distribution/
IMLS. "Distribution of public libraries operating revenue among sources in the United States from the fiscal year of 1995 to the fiscal year of 2019, as a share of total revenue." Chart. May 1, 2021. Statista. Accessed June 21, 2025. https://www.statista.com/statistics/1326622/us-public-libraries-operating-revenue-distribution/
IMLS. (2021). Distribution of public libraries operating revenue among sources in the United States from the fiscal year of 1995 to the fiscal year of 2019, as a share of total revenue. Statista. Statista Inc.. Accessed: June 21, 2025. https://www.statista.com/statistics/1326622/us-public-libraries-operating-revenue-distribution/
IMLS. "Distribution of Public Libraries Operating Revenue among Sources in The United States from The Fiscal Year of 1995 to The Fiscal Year of 2019, as a Share of Total Revenue." Statista, Statista Inc., 1 May 2021, https://www.statista.com/statistics/1326622/us-public-libraries-operating-revenue-distribution/
IMLS, Distribution of public libraries operating revenue among sources in the United States from the fiscal year of 1995 to the fiscal year of 2019, as a share of total revenue Statista, https://www.statista.com/statistics/1326622/us-public-libraries-operating-revenue-distribution/ (last visited June 21, 2025)
Distribution of public libraries operating revenue among sources in the United States from the fiscal year of 1995 to the fiscal year of 2019, as a share of total revenue [Graph], IMLS, May 1, 2021. [Online]. Available: https://www.statista.com/statistics/1326622/us-public-libraries-operating-revenue-distribution/
Advertisement
Profit from additional features with an Employee Account
Please create an employee account to be able to mark statistics as favorites.
Then you can access your favorite statistics via the star in the header.
Profit from the additional features of your individual account
Currently, you are using a shared account. To use individual functions (e.g., mark statistics as favourites, set
statistic alerts) please log in with your personal account.
If you are an admin, please authenticate by logging in again.