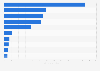
In the third quarter of 2023, Facebook Messenger generated in-app purchase (IAP) revenues of around 1,938 U.S. dollars in Brazil, up from 3,181 U.S. dollars from the first quarter of this year. The messaging platform hit its peak revenue between the last quarter of 2018 and first quarter of 2019.
App revenue generated by Facebook Messenger in Brazil from 1st quarter 2019 to 3rd quarter 2023
(in U.S. dollars)
Characteristic
Monthly revenue in U.S. dollars
2023 Q3
1,938
2023 Q2
2,883
2023 Q1
3,181
2022 Q4
2,238
2022 Q3
3,388
2022 Q2
2,917
2022 Q1
1,601
2021 Q4
1,710
2021 Q3
1,480
2021 Q2
686
2021 Q1
236
2020 Q4
661
2020 Q3
785
01,0002,0003,0004,0005,000
Add this content to your personal favorites. These can be accessed from the favorites menu in the main navigation.
You have no right to use this feature.
Make sure to contact us if you are interested in scientific citation.
You can upgrade your account to enable this functionality for all statistics.
This feature is not available with your current account.Request access
Learn more about how Statista can support your business.
AppMagic. (October 23, 2023). App revenue generated by Facebook Messenger in Brazil from 1st quarter 2019 to 3rd quarter 2023 (in U.S. dollars) [Graph]. In Statista. Retrieved May 12, 2025, from https://www.statista.com/statistics/1328518/brazil-facebook-messenger-app-revenue/
AppMagic. "App revenue generated by Facebook Messenger in Brazil from 1st quarter 2019 to 3rd quarter 2023 (in U.S. dollars)." Chart. October 23, 2023. Statista. Accessed May 12, 2025. https://www.statista.com/statistics/1328518/brazil-facebook-messenger-app-revenue/
AppMagic. (2023). App revenue generated by Facebook Messenger in Brazil from 1st quarter 2019 to 3rd quarter 2023 (in U.S. dollars). Statista. Statista Inc.. Accessed: May 12, 2025. https://www.statista.com/statistics/1328518/brazil-facebook-messenger-app-revenue/
AppMagic. "App Revenue Generated by Facebook Messenger in Brazil from 1st Quarter 2019 to 3rd Quarter 2023 (in U.S. Dollars)." Statista, Statista Inc., 23 Oct 2023, https://www.statista.com/statistics/1328518/brazil-facebook-messenger-app-revenue/
AppMagic, App revenue generated by Facebook Messenger in Brazil from 1st quarter 2019 to 3rd quarter 2023 (in U.S. dollars) Statista, https://www.statista.com/statistics/1328518/brazil-facebook-messenger-app-revenue/ (last visited May 12, 2025)
App revenue generated by Facebook Messenger in Brazil from 1st quarter 2019 to 3rd quarter 2023 (in U.S. dollars) [Graph], AppMagic, October 23, 2023. [Online]. Available: https://www.statista.com/statistics/1328518/brazil-facebook-messenger-app-revenue/
Profit from additional features with an Employee Account
Please create an employee account to be able to mark statistics as favorites.
Then you can access your favorite statistics via the star in the header.
Profit from the additional features of your individual account
Currently, you are using a shared account. To use individual functions (e.g., mark statistics as favourites, set
statistic alerts) please log in with your personal account.
If you are an admin, please authenticate by logging in again.