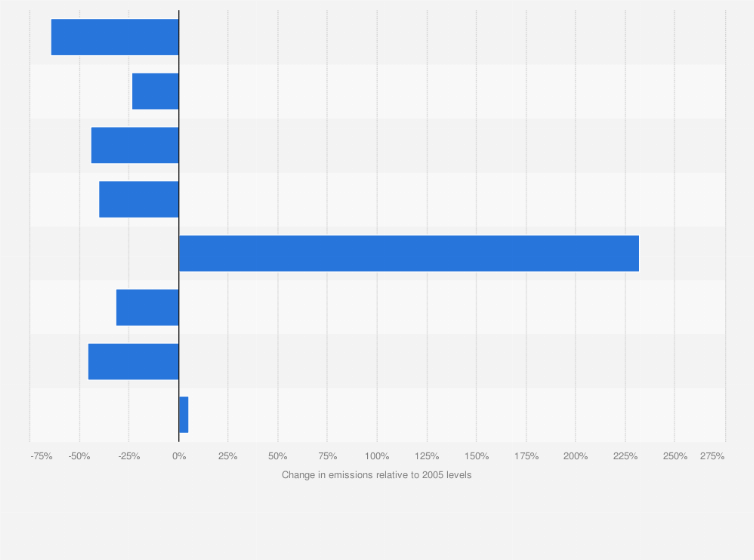
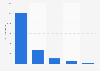
Various activity sectors in Europe have experienced emissions reductions since the European Union Emissions Trading System (EU ETS) was launched in 2005. Emissions from the combustion of fuels, which primarily come from the power sector, decreased by 64 percent between 2005 and 2024, while GHG emissions released by cement and lime production fell by around 44 percent. Meanwhile, emissions from the aviation industry, which have been included in the EU ETS since 2012, were roughly 5.2 percent above 2013 levels, while emissions from chemicals have more than tripled.
Change in verified emissions from key sectors covered by the European Union Emission Trading System (EU ETS) from 2005 to 2024
(in percent)
Adjust the presentation of the statistic and data points.
Share the statistic on social media channels or embed the statistic in your
website using "Embed Code", where available.
Cite this statistic and select one of the following formats: APA, Chicago, Harvard, MLA & Bluebook.
Print the statistic including description and metadata.
Chart type
Change in verified emissions from key sectors covered by the European Union Emission Trading System (EU ETS) from 2005 to 2024
Share this statistic
You have no right to use this feature.
Make sure to contact us if you are interested in scientific citation.
You can upgrade your account to enable this functionality for all statistics.
This feature is not available with your current account.Request access
Learn more about how Statista can support your business.
EEA, & Statista. (April 30, 2025). Change in verified emissions from key sectors covered by the European Union Emission Trading System (EU ETS) from 2005 to 2024 (in percent) [Graph]. In Statista. Retrieved May 07, 2025, from https://www.statista.com/statistics/1329331/eu-ets-emissions-change-by-sector/
EEA, und Statista. "Change in verified emissions from key sectors covered by the European Union Emission Trading System (EU ETS) from 2005 to 2024 (in percent)." Chart. April 30, 2025. Statista. Accessed May 07, 2025. https://www.statista.com/statistics/1329331/eu-ets-emissions-change-by-sector/
EEA, Statista. (2025). Change in verified emissions from key sectors covered by the European Union Emission Trading System (EU ETS) from 2005 to 2024 (in percent). Statista. Statista Inc.. Accessed: May 07, 2025. https://www.statista.com/statistics/1329331/eu-ets-emissions-change-by-sector/
EEA, and Statista. "Change in Verified Emissions from Key Sectors Covered by The European Union Emission Trading System (Eu Ets) from 2005 to 2024 (in Percent)." Statista, Statista Inc., 30 Apr 2025, https://www.statista.com/statistics/1329331/eu-ets-emissions-change-by-sector/
EEA & Statista, Change in verified emissions from key sectors covered by the European Union Emission Trading System (EU ETS) from 2005 to 2024 (in percent) Statista, https://www.statista.com/statistics/1329331/eu-ets-emissions-change-by-sector/ (last visited May 07, 2025)
Change in verified emissions from key sectors covered by the European Union Emission Trading System (EU ETS) from 2005 to 2024 (in percent) [Graph], EEA, & Statista, April 30, 2025. [Online]. Available: https://www.statista.com/statistics/1329331/eu-ets-emissions-change-by-sector/
Profit from additional features with an Employee Account
Please create an employee account to be able to mark statistics as favorites.
Then you can access your favorite statistics via the star in the header.
Profit from the additional features of your individual account
Currently, you are using a shared account. To use individual functions (e.g., mark statistics as favourites, set
statistic alerts) please log in with your personal account.
If you are an admin, please authenticate by logging in again.