coop.nl, operated by Coop Supermarkten, is an online store with nationally-focused sales. Its e-commerce net sales are generated almost entirely in the Netherlands. With regards to the product range, coop.nl specializes in the “Food & Personal Care” category, particularly in the area of “Food & Beverages”.
Advertisement
Advertisement
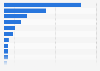
E-commerce net sales of Coop Supermarkten from 2015 to 2025
(in million U.S. dollars)
Characteristic
First-party e-commerce net sales in million U.S. dollars
2025*
37.7
2024*
38.5
2023
39.7
2022
45.3
2021
60.5
2020
61.7
2019
43.4
2018
35.3
2017
21.2
2016
13.3
2015
10.3
010203040506070
Add this content to your personal favorites. These can be accessed from the favorites menu in the main navigation.
You have no right to use this feature.
Make sure to contact us if you are interested in scientific citation.
You can upgrade your account to enable this functionality for all statistics.
This feature is not available with your current account.Request access
The e-commerce market encompasses the sale of physical goods via a digital channel to a private end user (B2C). Incorporated in this definition are purchases via desktop computer (including notebooks and laptops) as well as purchases via mobile devices such as smartphones and tablets.
The following are not included in the e-commerce market: marketplace platforms only, digitally distributed services (e.g. travel tickets), online stores dedicated to digital media downloads or streams as well as online stores dedicated to B2B markets nor sales between private persons (C2C). Market volume, market growth and all monetary figures at store level refer to the annual e-commerce net sales after the deduction of returns.
Learn more about how Statista can support your business.
ecommerceDB.com. (August 9, 2024). E-commerce net sales of Coop Supermarkten from 2015 to 2025 (in million U.S. dollars) [Graph]. In Statista. Retrieved June 13, 2025, from https://www.statista.com/statistics/1330365/coop-nl-revenue-development-ecommercedb/
ecommerceDB.com. "E-commerce net sales of Coop Supermarkten from 2015 to 2025 (in million U.S. dollars)." Chart. August 9, 2024. Statista. Accessed June 13, 2025. https://www.statista.com/statistics/1330365/coop-nl-revenue-development-ecommercedb/
ecommerceDB.com. (2024). E-commerce net sales of Coop Supermarkten from 2015 to 2025 (in million U.S. dollars). Statista. Statista Inc.. Accessed: June 13, 2025. https://www.statista.com/statistics/1330365/coop-nl-revenue-development-ecommercedb/
ecommerceDB.com. "E-commerce Net Sales of Coop Supermarkten from 2015 to 2025 (in Million U.S. Dollars)." Statista, Statista Inc., 9 Aug 2024, https://www.statista.com/statistics/1330365/coop-nl-revenue-development-ecommercedb/
ecommerceDB.com, E-commerce net sales of Coop Supermarkten from 2015 to 2025 (in million U.S. dollars) Statista, https://www.statista.com/statistics/1330365/coop-nl-revenue-development-ecommercedb/ (last visited June 13, 2025)
E-commerce net sales of Coop Supermarkten from 2015 to 2025 (in million U.S. dollars) [Graph], ecommerceDB.com, August 9, 2024. [Online]. Available: https://www.statista.com/statistics/1330365/coop-nl-revenue-development-ecommercedb/
Advertisement
Profit from additional features with an Employee Account
Please create an employee account to be able to mark statistics as favorites.
Then you can access your favorite statistics via the star in the header.
Profit from the additional features of your individual account
Currently, you are using a shared account. To use individual functions (e.g., mark statistics as favourites, set
statistic alerts) please log in with your personal account.
If you are an admin, please authenticate by logging in again.