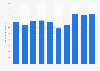
Imported products occupied nearly 32 percent of chilled trout sold in Russia in physical terms in 2021. The share of imports in the total sales volume marked a decrease compared to the previous year. In 2015, the figures decreased sharply in view of Russian countersanctions on several Western countries.
Profit from the additional features of your individual account
Currently, you are using a shared account. To use individual functions (e.g., mark statistics as favourites, set
statistic alerts) please log in with your personal account.
If you are an admin, please authenticate by logging in again.
Learn more about how Statista can support your business.
Gidmarket. (June 21, 2022). Share of imports in sales volume of chilled trout in Russia from 2014 to 2021 [Graph]. In Statista. Retrieved July 05, 2025, from https://www.statista.com/statistics/1333706/russia-import-share-in-chilled-trout-sales/
Gidmarket. "Share of imports in sales volume of chilled trout in Russia from 2014 to 2021." Chart. June 21, 2022. Statista. Accessed July 05, 2025. https://www.statista.com/statistics/1333706/russia-import-share-in-chilled-trout-sales/
Gidmarket. (2022). Share of imports in sales volume of chilled trout in Russia from 2014 to 2021. Statista. Statista Inc.. Accessed: July 05, 2025. https://www.statista.com/statistics/1333706/russia-import-share-in-chilled-trout-sales/
Gidmarket. "Share of Imports in Sales Volume of Chilled Trout in Russia from 2014 to 2021." Statista, Statista Inc., 21 Jun 2022, https://www.statista.com/statistics/1333706/russia-import-share-in-chilled-trout-sales/
Gidmarket, Share of imports in sales volume of chilled trout in Russia from 2014 to 2021 Statista, https://www.statista.com/statistics/1333706/russia-import-share-in-chilled-trout-sales/ (last visited July 05, 2025)
Share of imports in sales volume of chilled trout in Russia from 2014 to 2021 [Graph], Gidmarket, June 21, 2022. [Online]. Available: https://www.statista.com/statistics/1333706/russia-import-share-in-chilled-trout-sales/