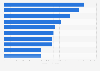
In 2020, the total revenue generated by medical technology companies in Italy amounted to over 18.6 billion euros. This statistic shows how this revenue was distributed across the different product groups. Around one third of the revenue was generated through the sale of electromedical devices, while biomedical equipment accounted for about 18 percent of the total revenue.
Distribution of Italy's medical technology revenue in 2020, by product*
Characteristic
Share of revenue
Biomedical equipment
18%
Electromedical equipment
32.6%
Contrast agents, reagents, and in-vitro diagnostics
16.1%
Hearing aids, dentures, ocular prostheses, and prosthetic implants
17.3%
Lab equipment
14%
Equipment and aids
2%
• Biomedical equipment 18%
• Electromedical equipment 32.6%
• Contrast agents, reagents, and in-vitro diagnostics 16.1%
• Hearing aids, dentures, ocular prostheses, and prosthetic implants 17.3%
• Lab equipment 14%
• Equipment and aids 2%
Add this content to your personal favorites. These can be accessed from the favorites menu in the main navigation.
You have no right to use this feature.
Make sure to contact us if you are interested in scientific citation.
You can upgrade your account to enable this functionality for all statistics.
This feature is not available with your current account.Request access
*The figure includes all companies (227) with headquarters in Italy and turnover of more than 10 million euros in 2020, as well as commercial enterprises operating on Italian territory that in 2020 achieved a turnover of more than 30 million euros.
Learn more about how Statista can support your business.
Mediobanca. (April 12, 2022). Distribution of Italy's medical technology revenue in 2020, by product* [Graph]. In Statista. Retrieved May 11, 2025, from https://www.statista.com/statistics/1334491/revenue-distribution-of-medtech-companies-in-italy-by-product/
Mediobanca. "Distribution of Italy's medical technology revenue in 2020, by product*." Chart. April 12, 2022. Statista. Accessed May 11, 2025. https://www.statista.com/statistics/1334491/revenue-distribution-of-medtech-companies-in-italy-by-product/
Mediobanca. (2022). Distribution of Italy's medical technology revenue in 2020, by product*. Statista. Statista Inc.. Accessed: May 11, 2025. https://www.statista.com/statistics/1334491/revenue-distribution-of-medtech-companies-in-italy-by-product/
Mediobanca. "Distribution of Italy's Medical Technology Revenue in 2020, by Product*." Statista, Statista Inc., 12 Apr 2022, https://www.statista.com/statistics/1334491/revenue-distribution-of-medtech-companies-in-italy-by-product/
Mediobanca, Distribution of Italy's medical technology revenue in 2020, by product* Statista, https://www.statista.com/statistics/1334491/revenue-distribution-of-medtech-companies-in-italy-by-product/ (last visited May 11, 2025)
Distribution of Italy's medical technology revenue in 2020, by product* [Graph], Mediobanca, April 12, 2022. [Online]. Available: https://www.statista.com/statistics/1334491/revenue-distribution-of-medtech-companies-in-italy-by-product/
Profit from additional features with an Employee Account
Please create an employee account to be able to mark statistics as favorites.
Then you can access your favorite statistics via the star in the header.
Profit from the additional features of your individual account
Currently, you are using a shared account. To use individual functions (e.g., mark statistics as favourites, set
statistic alerts) please log in with your personal account.
If you are an admin, please authenticate by logging in again.