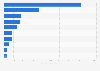
Around 37 percent of South Korea's imports of plastics and articles thereof came from China in 2023, making it the largest plastics source for South Korea that year. Japan was the second-largest source of plastics that year, at nearly 21 percent.
Advertisement
Advertisement
Distribution of import value for plastics and articles thereof from South Korea in 2023, by country
Adjust the presentation of the statistic and data points.
Share the statistic on social media channels or embed the statistic in your
website using "Embed Code", where available.
Cite this statistic and select one of the following formats: APA, Chicago, Harvard, MLA & Bluebook.
Print the statistic including description and metadata.
Chart type
Distribution of import value for plastics and articles thereof from South Korea in 2023, by country
Share this statistic
You have no right to use this feature.
Make sure to contact us if you are interested in scientific citation.
You can upgrade your account to enable this functionality for all statistics.
This feature is not available with your current account.Request access
Learn more about how Statista can support your business.
Korea Customs Service. (October 18, 2024). Distribution of import value for plastics and articles thereof from South Korea in 2023, by country [Graph]. In Statista. Retrieved June 15, 2025, from https://www.statista.com/statistics/1338341/south-korea-share-of-import-value-for-plastics-and-articles-thereof-by-country/
Korea Customs Service. "Distribution of import value for plastics and articles thereof from South Korea in 2023, by country." Chart. October 18, 2024. Statista. Accessed June 15, 2025. https://www.statista.com/statistics/1338341/south-korea-share-of-import-value-for-plastics-and-articles-thereof-by-country/
Korea Customs Service. (2024). Distribution of import value for plastics and articles thereof from South Korea in 2023, by country. Statista. Statista Inc.. Accessed: June 15, 2025. https://www.statista.com/statistics/1338341/south-korea-share-of-import-value-for-plastics-and-articles-thereof-by-country/
Korea Customs Service. "Distribution of Import Value for Plastics and Articles Thereof from South Korea in 2023, by Country." Statista, Statista Inc., 18 Oct 2024, https://www.statista.com/statistics/1338341/south-korea-share-of-import-value-for-plastics-and-articles-thereof-by-country/
Korea Customs Service, Distribution of import value for plastics and articles thereof from South Korea in 2023, by country Statista, https://www.statista.com/statistics/1338341/south-korea-share-of-import-value-for-plastics-and-articles-thereof-by-country/ (last visited June 15, 2025)
Distribution of import value for plastics and articles thereof from South Korea in 2023, by country [Graph], Korea Customs Service, October 18, 2024. [Online]. Available: https://www.statista.com/statistics/1338341/south-korea-share-of-import-value-for-plastics-and-articles-thereof-by-country/
Advertisement
Profit from additional features with an Employee Account
Please create an employee account to be able to mark statistics as favorites.
Then you can access your favorite statistics via the star in the header.
Profit from the additional features of your individual account
Currently, you are using a shared account. To use individual functions (e.g., mark statistics as favourites, set
statistic alerts) please log in with your personal account.
If you are an admin, please authenticate by logging in again.