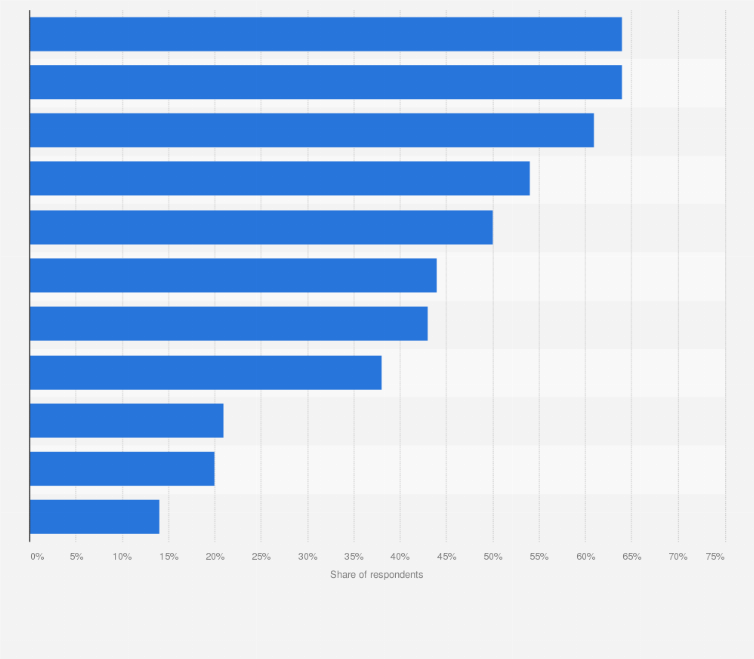
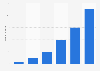
According to a 2021 survey among adult consumers in China, nearly two-thirds of respondents said they bought or intended to buy groceries on social media platforms. In comparison, only 21 percent of the respondents said they bought or planned on purchasing luxury goods via social commerce.
Advertisement
Advertisement
Share of consumers who bought or intended to buy things on social commerce platforms in China as of July 2021, by product category
Adjust the presentation of the statistic and data points.
Share the statistic on social media channels or embed the statistic in your
website using "Embed Code", where available.
Cite this statistic and select one of the following formats: APA, Chicago, Harvard, MLA & Bluebook.
Print the statistic including description and metadata.
Chart type
Share of consumers who bought or intended to buy things on social commerce platforms in China as of July 2021, by product category
Share this statistic
You have no right to use this feature.
Make sure to contact us if you are interested in scientific citation.
You can upgrade your account to enable this functionality for all statistics.
This feature is not available with your current account.Request access
Learn more about how Statista can support your business.
Essence. (November 21, 2021). Share of consumers who bought or intended to buy things on social commerce platforms in China as of July 2021, by product category [Graph]. In Statista. Retrieved June 26, 2025, from https://www.statista.com/statistics/1338696/china-most-purchased-product-categories-using-social-commerce/
Essence. "Share of consumers who bought or intended to buy things on social commerce platforms in China as of July 2021, by product category." Chart. November 21, 2021. Statista. Accessed June 26, 2025. https://www.statista.com/statistics/1338696/china-most-purchased-product-categories-using-social-commerce/
Essence. (2021). Share of consumers who bought or intended to buy things on social commerce platforms in China as of July 2021, by product category. Statista. Statista Inc.. Accessed: June 26, 2025. https://www.statista.com/statistics/1338696/china-most-purchased-product-categories-using-social-commerce/
Essence. "Share of Consumers Who Bought or Intended to Buy Things on Social Commerce Platforms in China as of July 2021, by Product Category." Statista, Statista Inc., 21 Nov 2021, https://www.statista.com/statistics/1338696/china-most-purchased-product-categories-using-social-commerce/
Essence, Share of consumers who bought or intended to buy things on social commerce platforms in China as of July 2021, by product category Statista, https://www.statista.com/statistics/1338696/china-most-purchased-product-categories-using-social-commerce/ (last visited June 26, 2025)
Share of consumers who bought or intended to buy things on social commerce platforms in China as of July 2021, by product category [Graph], Essence, November 21, 2021. [Online]. Available: https://www.statista.com/statistics/1338696/china-most-purchased-product-categories-using-social-commerce/
Advertisement
Profit from additional features with an Employee Account
Please create an employee account to be able to mark statistics as favorites.
Then you can access your favorite statistics via the star in the header.
Profit from the additional features of your individual account
Currently, you are using a shared account. To use individual functions (e.g., mark statistics as favourites, set
statistic alerts) please log in with your personal account.
If you are an admin, please authenticate by logging in again.