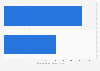
Parler is an alt-tech social networking service which was launched in September 2018. The platform is marketed as a free speech platform but has also been criticized for its far-right user base. In January 2021, the month of the United States Capitol attack, Parler saw over 12.3 million unique visitors. However, the platform could not maintain its surge in popularity. As of August 2022, Parler had only 137 thousand unique monthly visitors.
In October 2022, the artist Ye (formerly known as Kanye West) announced that he intended to purchase social media platform Parler after having been kicked off Twitter and Instagram for antisemitic hate speech.
Advertisement
Advertisement
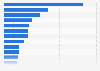
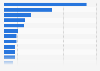
Average unique monthly visitors to Parler in the United States from January to August 2021 and 2022
(in 1,000s)
Characteristic
2021
2022
Aug
766
137
Jul
874
496
Jun
1,421
437
May
2,060
543
Apr
2,228
819
Mar
3,373
666
Feb
4,323
625
Jan
12,301
733
02,5005,0007,50010,00012,50015,000
Add this content to your personal favorites. These can be accessed from the favorites menu in the main navigation.
You have no right to use this feature.
Make sure to contact us if you are interested in scientific citation.
You can upgrade your account to enable this functionality for all statistics.
This feature is not available with your current account.Request access
Learn more about how Statista can support your business.
TheRighting. (October 18, 2022). Average unique monthly visitors to Parler in the United States from January to August 2021 and 2022 (in 1,000s) [Graph]. In Statista. Retrieved July 13, 2025, from https://www.statista.com/statistics/1340608/parler-us-monthly-visitors/
TheRighting. "Average unique monthly visitors to Parler in the United States from January to August 2021 and 2022 (in 1,000s)." Chart. October 18, 2022. Statista. Accessed July 13, 2025. https://www.statista.com/statistics/1340608/parler-us-monthly-visitors/
TheRighting. (2022). Average unique monthly visitors to Parler in the United States from January to August 2021 and 2022 (in 1,000s). Statista. Statista Inc.. Accessed: July 13, 2025. https://www.statista.com/statistics/1340608/parler-us-monthly-visitors/
TheRighting. "Average Unique Monthly Visitors to Parler in The United States from January to August 2021 and 2022 (in 1,000s)." Statista, Statista Inc., 18 Oct 2022, https://www.statista.com/statistics/1340608/parler-us-monthly-visitors/
TheRighting, Average unique monthly visitors to Parler in the United States from January to August 2021 and 2022 (in 1,000s) Statista, https://www.statista.com/statistics/1340608/parler-us-monthly-visitors/ (last visited July 13, 2025)
Average unique monthly visitors to Parler in the United States from January to August 2021 and 2022 (in 1,000s) [Graph], TheRighting, October 18, 2022. [Online]. Available: https://www.statista.com/statistics/1340608/parler-us-monthly-visitors/
Advertisement
Profit from additional features with an Employee Account
Please create an employee account to be able to mark statistics as favorites.
Then you can access your favorite statistics via the star in the header.
Profit from the additional features of your individual account
Currently, you are using a shared account. To use individual functions (e.g., mark statistics as favourites, set
statistic alerts) please log in with your personal account.
If you are an admin, please authenticate by logging in again.


 Alt-tech