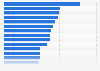
Projects seeking to be connected to the power grid in the United States spent on average four years in interconnection queues between 2018 and 2022. This represents an increase of 100 percent in comparison to the previous decade, when projects had to wait on average two years from the request until commercial operation. In 2022, the capacity in interconnection queues in the U.S. surpassed *** terawatts.
Time from connection request to commercial operation
Supplementary notes
According to the source, interconnection queue data through the end of 2022 was compiled for seven independent system operators (ISOs) and 35 utilities, serving about 85 percent of all U.S. electricity load.
Profit from the additional features of your individual account
Currently, you are using a shared account. To use individual functions (e.g., mark statistics as favourites, set
statistic alerts) please log in with your personal account.
If you are an admin, please authenticate by logging in again.
Learn more about how Statista can support your business.
Lawrence Berkeley National Laboratory. (April 15, 2023). Average interconnection queue waiting time in the United States from 2000 to 2022 (in years) [Graph]. In Statista. Retrieved July 19, 2025, from https://www.statista.com/statistics/1343106/interconnection-queue-waiting-time-united-states/
Lawrence Berkeley National Laboratory. "Average interconnection queue waiting time in the United States from 2000 to 2022 (in years)." Chart. April 15, 2023. Statista. Accessed July 19, 2025. https://www.statista.com/statistics/1343106/interconnection-queue-waiting-time-united-states/
Lawrence Berkeley National Laboratory. (2023). Average interconnection queue waiting time in the United States from 2000 to 2022 (in years). Statista. Statista Inc.. Accessed: July 19, 2025. https://www.statista.com/statistics/1343106/interconnection-queue-waiting-time-united-states/
Lawrence Berkeley National Laboratory. "Average Interconnection Queue Waiting Time in The United States from 2000 to 2022 (in Years)." Statista, Statista Inc., 15 Apr 2023, https://www.statista.com/statistics/1343106/interconnection-queue-waiting-time-united-states/
Lawrence Berkeley National Laboratory, Average interconnection queue waiting time in the United States from 2000 to 2022 (in years) Statista, https://www.statista.com/statistics/1343106/interconnection-queue-waiting-time-united-states/ (last visited July 19, 2025)
Average interconnection queue waiting time in the United States from 2000 to 2022 (in years) [Graph], Lawrence Berkeley National Laboratory, April 15, 2023. [Online]. Available: https://www.statista.com/statistics/1343106/interconnection-queue-waiting-time-united-states/