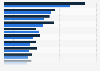
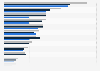
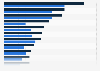
High-rise apartments with five floors or more were the buildings with the highest construction price increase in Canada in 2023. On the other side of the spectrum, the price of building a school was well below the average for eleven metropolitan areas across the country in the past years. In 2021 and 2022, the construction of several types of buildings saw two-figure growth rates.
Annual growth rate of building construction prices in metropolitan areas of Canada from 2018 to 2023, by type of building
Adjust the presentation of the statistic and data points.
Share the statistic on social media channels or embed the statistic in your
website using "Embed Code", where available.
Cite this statistic and select one of the following formats: APA, Chicago, Harvard, MLA & Bluebook.
Print the statistic including description and metadata.
Chart type
Annual growth rate of building construction prices in metropolitan areas of Canada from 2018 to 2023, by type of building
Share this statistic
You have no right to use this feature.
Make sure to contact us if you are interested in scientific citation.
You can upgrade your account to enable this functionality for all statistics.
This feature is not available with your current account.Request access
Composite of eleven metropolitan areas, see more in the details tab.
Supplementary notes
The data is a composite of eleven metropolitan areas, including: St. John's, Halifax, Moncton, Montréal, Ottawa-Gatineau, Toronto, Winnipeg, Saskatoon, Calgary, Edmonton, Vancouver.
Learn more about how Statista can support your business.
Statista. (June 11, 2024). Annual growth rate of building construction prices in metropolitan areas of Canada from 2018 to 2023, by type of building [Graph]. In Statista. Retrieved June 08, 2025, from https://www.statista.com/statistics/1344162/canada-price-index-for-building-construction-by-type-of-building/
Statista. "Annual growth rate of building construction prices in metropolitan areas of Canada from 2018 to 2023, by type of building." Chart. June 11, 2024. Statista. Accessed June 08, 2025. https://www.statista.com/statistics/1344162/canada-price-index-for-building-construction-by-type-of-building/
Statista. (2024). Annual growth rate of building construction prices in metropolitan areas of Canada from 2018 to 2023, by type of building. Statista. Statista Inc.. Accessed: June 08, 2025. https://www.statista.com/statistics/1344162/canada-price-index-for-building-construction-by-type-of-building/
Statista. "Annual Growth Rate of Building Construction Prices in Metropolitan Areas of Canada from 2018 to 2023, by Type of Building." Statista, Statista Inc., 11 Jun 2024, https://www.statista.com/statistics/1344162/canada-price-index-for-building-construction-by-type-of-building/
Statista, Annual growth rate of building construction prices in metropolitan areas of Canada from 2018 to 2023, by type of building Statista, https://www.statista.com/statistics/1344162/canada-price-index-for-building-construction-by-type-of-building/ (last visited June 08, 2025)
Annual growth rate of building construction prices in metropolitan areas of Canada from 2018 to 2023, by type of building [Graph], Statista, June 11, 2024. [Online]. Available: https://www.statista.com/statistics/1344162/canada-price-index-for-building-construction-by-type-of-building/
Profit from additional features with an Employee Account
Please create an employee account to be able to mark statistics as favorites.
Then you can access your favorite statistics via the star in the header.
Profit from the additional features of your individual account
Currently, you are using a shared account. To use individual functions (e.g., mark statistics as favourites, set
statistic alerts) please log in with your personal account.
If you are an admin, please authenticate by logging in again.