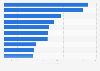
According to a study focusing on travel and hospitality websites worldwide, desktop users recorded a higher average conversion rate than mobile users in that market in 2024. That year, while the conversion rate from desktop was almost six percent, just 2.7 percent of visitors who accessed travel websites via mobile finalized their booking. That said, mobiles generated the highest traffic share of travel and hospitality websites worldwide in 2024.
Average conversion rate of travel and hospitality websites worldwide in 2023 and 2024, by device
The source examined approximately 90 billion anonymized user sessions related to nine industries, including travel and hospitality, across 6,000 websites worldwide.
2024 data refers to the period from October 2023 to December 2024. Figures for 2023 were calculated by Statista based on the annual percentage changes provided by the source.
The source specifies that travel and hospitality refers to the following industries: airlines, fitness and wellness, cruise lines, restaurants, car and truck rentals, travel agencies and services, hotels and resorts.
Profit from the additional features of your individual account
Currently, you are using a shared account. To use individual functions (e.g., mark statistics as favourites, set
statistic alerts) please log in with your personal account.
If you are an admin, please authenticate by logging in again.
Learn more about how Statista can support your business.
ContentSquare. (January 23, 2025). Average conversion rate of travel and hospitality websites worldwide in 2023 and 2024, by device [Graph]. In Statista. Retrieved June 06, 2025, from https://www.statista.com/statistics/1350599/conversion-rate-travel-tourism-websites-by-device-worldwide/
ContentSquare. "Average conversion rate of travel and hospitality websites worldwide in 2023 and 2024, by device." Chart. January 23, 2025. Statista. Accessed June 06, 2025. https://www.statista.com/statistics/1350599/conversion-rate-travel-tourism-websites-by-device-worldwide/
ContentSquare. (2025). Average conversion rate of travel and hospitality websites worldwide in 2023 and 2024, by device. Statista. Statista Inc.. Accessed: June 06, 2025. https://www.statista.com/statistics/1350599/conversion-rate-travel-tourism-websites-by-device-worldwide/
ContentSquare. "Average Conversion Rate of Travel and Hospitality Websites Worldwide in 2023 and 2024, by Device." Statista, Statista Inc., 23 Jan 2025, https://www.statista.com/statistics/1350599/conversion-rate-travel-tourism-websites-by-device-worldwide/
ContentSquare, Average conversion rate of travel and hospitality websites worldwide in 2023 and 2024, by device Statista, https://www.statista.com/statistics/1350599/conversion-rate-travel-tourism-websites-by-device-worldwide/ (last visited June 06, 2025)
Average conversion rate of travel and hospitality websites worldwide in 2023 and 2024, by device [Graph], ContentSquare, January 23, 2025. [Online]. Available: https://www.statista.com/statistics/1350599/conversion-rate-travel-tourism-websites-by-device-worldwide/