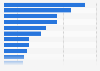
In 2024, image posts on Instagram reached 5,200 users, down from 14,800 users in 2023, a decrease of around 64 percent year over year. Carousels, Reels, and Stories on Instagram all saw reach decline between 2023 and 2024. Overall, Reels achieved the highest reach on the social media platform in the most recently reported period. Although all formats saw decreases in reach, engagement increased, so whilst there might not be as many users seeing content, people are interacting more with the content they see on Instagram.
Average user reach per post on Instagram from 2023 to 2024, by format
Characteristic
2023
2024
Stories
1.7
0.91
Reel
18.4
11
Reel from feed*
7.7
4.3
Carousel
18.6
7.8
Image
14.8
5.2
0510152025
Add this content to your personal favorites. These can be accessed from the favorites menu in the main navigation.
You have no right to use this feature.
Make sure to contact us if you are interested in scientific citation.
You can upgrade your account to enable this functionality for all statistics.
This feature is not available with your current account.Request access
391,490 professional Instagram accounts (business and creator); 5,608,075 feed posts; 3,614,692 reels; 23,626,292 stories; 3,739,969 images; 1,848,495 carousels; 19,611 *reels from feed
Supplementary notes
According to the source: *Since Instagram categorizes all video formats as Reels, we differentiate those shared in the main feed from Reels shared exclusively in the reel feed. The former will be included in the Feed posts category.
Learn more about how Statista can support your business.
Metricool. (September 1, 2024). Average user reach per post on Instagram from 2023 to 2024, by format [Graph]. In Statista. Retrieved May 08, 2025, from https://www.statista.com/statistics/1353279/average-reach-per-post-instagram/
Metricool. "Average user reach per post on Instagram from 2023 to 2024, by format." Chart. September 1, 2024. Statista. Accessed May 08, 2025. https://www.statista.com/statistics/1353279/average-reach-per-post-instagram/
Metricool. (2024). Average user reach per post on Instagram from 2023 to 2024, by format. Statista. Statista Inc.. Accessed: May 08, 2025. https://www.statista.com/statistics/1353279/average-reach-per-post-instagram/
Metricool. "Average User Reach per Post on Instagram from 2023 to 2024, by Format." Statista, Statista Inc., 1 Sep 2024, https://www.statista.com/statistics/1353279/average-reach-per-post-instagram/
Metricool, Average user reach per post on Instagram from 2023 to 2024, by format Statista, https://www.statista.com/statistics/1353279/average-reach-per-post-instagram/ (last visited May 08, 2025)
Average user reach per post on Instagram from 2023 to 2024, by format [Graph], Metricool, September 1, 2024. [Online]. Available: https://www.statista.com/statistics/1353279/average-reach-per-post-instagram/
Profit from additional features with an Employee Account
Please create an employee account to be able to mark statistics as favorites.
Then you can access your favorite statistics via the star in the header.
Profit from the additional features of your individual account
Currently, you are using a shared account. To use individual functions (e.g., mark statistics as favourites, set
statistic alerts) please log in with your personal account.
If you are an admin, please authenticate by logging in again.