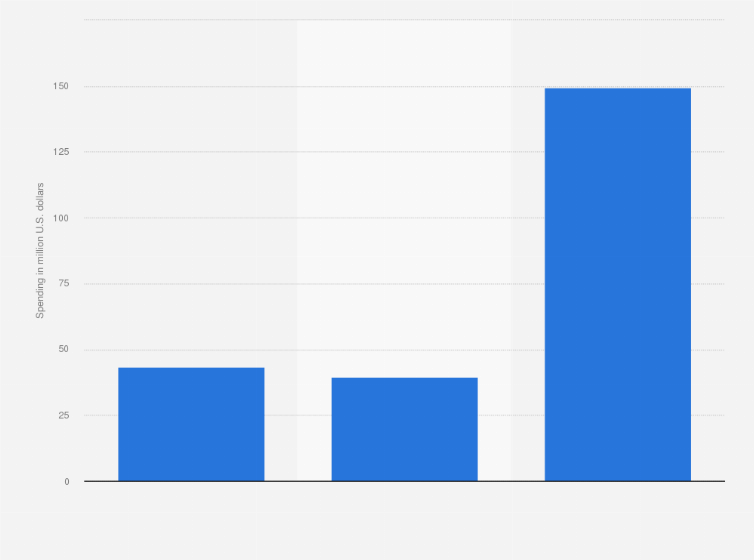
The expenditure on digital static display advertising of the entertainment & leisure category in Australia increased by 109.8 million U.S. dollars (276.59 percent) in 2021 in comparison to the previous year. Therefore, the advertising spending in Australia reached a peak in 2021 with 149.47 million U.S. dollars. For more insights about advertising in Australia: In 2021, in comparison to the ad expenditure of the entertainment & leisure category on internet, the ad expenditure of the entertainment & leisure category on outdoor was lower and on magazines it was considerably lower.
Advertisement
Advertisement
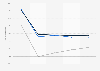
Entertainment & leisure advertising spending on digital static display in Australia from 2019 to 2021
(in million U.S. dollars)
Adjust the presentation of the statistic and data points.
Share the statistic on social media channels or embed the statistic in your
website using "Embed Code", where available.
Cite this statistic and select one of the following formats: APA, Chicago, Harvard, MLA & Bluebook.
Print the statistic including description and metadata.
Chart type
Entertainment & leisure advertising spending on digital static display in Australia from 2019 to 2021
Share this statistic
You have no right to use this feature.
Make sure to contact us if you are interested in scientific citation.
You can upgrade your account to enable this functionality for all statistics.
This feature is not available with your current account.Request access
Learn more about how Statista can support your business.
Nielsen. (December 16, 2022). Entertainment & leisure advertising spending on digital static display in Australia from 2019 to 2021 (in million U.S. dollars) [Graph]. In Statista. Retrieved June 28, 2025, from https://www.statista.com/statistics/1353582/entertainment-leisure-ad-spend-digital-static-display-australia/
Nielsen. "Entertainment & leisure advertising spending on digital static display in Australia from 2019 to 2021 (in million U.S. dollars)." Chart. December 16, 2022. Statista. Accessed June 28, 2025. https://www.statista.com/statistics/1353582/entertainment-leisure-ad-spend-digital-static-display-australia/
Nielsen. (2022). Entertainment & leisure advertising spending on digital static display in Australia from 2019 to 2021 (in million U.S. dollars). Statista. Statista Inc.. Accessed: June 28, 2025. https://www.statista.com/statistics/1353582/entertainment-leisure-ad-spend-digital-static-display-australia/
Nielsen. "Entertainment & Leisure Advertising Spending on Digital Static Display in Australia from 2019 to 2021 (in Million U.S. Dollars)." Statista, Statista Inc., 16 Dec 2022, https://www.statista.com/statistics/1353582/entertainment-leisure-ad-spend-digital-static-display-australia/
Nielsen, Entertainment & leisure advertising spending on digital static display in Australia from 2019 to 2021 (in million U.S. dollars) Statista, https://www.statista.com/statistics/1353582/entertainment-leisure-ad-spend-digital-static-display-australia/ (last visited June 28, 2025)
Entertainment & leisure advertising spending on digital static display in Australia from 2019 to 2021 (in million U.S. dollars) [Graph], Nielsen, December 16, 2022. [Online]. Available: https://www.statista.com/statistics/1353582/entertainment-leisure-ad-spend-digital-static-display-australia/
Advertisement
Profit from additional features with an Employee Account
Please create an employee account to be able to mark statistics as favorites.
Then you can access your favorite statistics via the star in the header.
Profit from the additional features of your individual account
Currently, you are using a shared account. To use individual functions (e.g., mark statistics as favourites, set
statistic alerts) please log in with your personal account.
If you are an admin, please authenticate by logging in again.