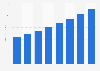
The digital static display ad spend of the business services category in Italy increased by 63.9 million U.S. dollars (+13.45 percent) in 2021 in comparison to the previous year. This was the first time during the observed period that the advertising spending has increased in Italy. For more insights about advertising in Italy: In 2021, in comparison to the ad expenditure of the business services category on digital static display, the ad expenditure of the business services category on magazines as well as on outdoor was considerably lower.
Profit from the additional features of your individual account
Currently, you are using a shared account. To use individual functions (e.g., mark statistics as favourites, set
statistic alerts) please log in with your personal account.
If you are an admin, please authenticate by logging in again.
Learn more about how Statista can support your business.
Nielsen. (December 16, 2022). Business services advertising spending on digital static display in Italy from 2019 to 2021 (in million U.S. dollars) [Graph]. In Statista. Retrieved July 07, 2025, from https://www.statista.com/statistics/1354307/business-services-ad-spend-digital-static-display-italy/
Nielsen. "Business services advertising spending on digital static display in Italy from 2019 to 2021 (in million U.S. dollars)." Chart. December 16, 2022. Statista. Accessed July 07, 2025. https://www.statista.com/statistics/1354307/business-services-ad-spend-digital-static-display-italy/
Nielsen. (2022). Business services advertising spending on digital static display in Italy from 2019 to 2021 (in million U.S. dollars). Statista. Statista Inc.. Accessed: July 07, 2025. https://www.statista.com/statistics/1354307/business-services-ad-spend-digital-static-display-italy/
Nielsen. "Business Services Advertising Spending on Digital Static Display in Italy from 2019 to 2021 (in Million U.S. Dollars)." Statista, Statista Inc., 16 Dec 2022, https://www.statista.com/statistics/1354307/business-services-ad-spend-digital-static-display-italy/
Nielsen, Business services advertising spending on digital static display in Italy from 2019 to 2021 (in million U.S. dollars) Statista, https://www.statista.com/statistics/1354307/business-services-ad-spend-digital-static-display-italy/ (last visited July 07, 2025)
Business services advertising spending on digital static display in Italy from 2019 to 2021 (in million U.S. dollars) [Graph], Nielsen, December 16, 2022. [Online]. Available: https://www.statista.com/statistics/1354307/business-services-ad-spend-digital-static-display-italy/