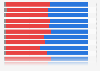
In the 118th Congress, 46.1 percent of members of the House of Representatives had already served one to three terms in the House. In the same Congress, a greater share of members had served ten or more years than those who served seven to nine terms.
Advertisement
Advertisement
Distribution of members in the United States House of Representatives from 1967 to 2023, by term length
Profit from the additional features of your individual account
Currently, you are using a shared account. To use individual functions (e.g., mark statistics as favourites, set
statistic alerts) please log in with your personal account.
If you are an admin, please authenticate by logging in again.
Learn more about how Statista can support your business.
Brookings Institution. (November 24, 2024). Distribution of members in the United States House of Representatives from 1967 to 2023, by term length [Graph]. In Statista. Retrieved June 24, 2025, from https://www.statista.com/statistics/1361949/house-representatives-term-length-us/
Brookings Institution. "Distribution of members in the United States House of Representatives from 1967 to 2023, by term length." Chart. November 24, 2024. Statista. Accessed June 24, 2025. https://www.statista.com/statistics/1361949/house-representatives-term-length-us/
Brookings Institution. (2024). Distribution of members in the United States House of Representatives from 1967 to 2023, by term length. Statista. Statista Inc.. Accessed: June 24, 2025. https://www.statista.com/statistics/1361949/house-representatives-term-length-us/
Brookings Institution. "Distribution of Members in The United States House of Representatives from 1967 to 2023, by Term Length." Statista, Statista Inc., 24 Nov 2024, https://www.statista.com/statistics/1361949/house-representatives-term-length-us/
Brookings Institution, Distribution of members in the United States House of Representatives from 1967 to 2023, by term length Statista, https://www.statista.com/statistics/1361949/house-representatives-term-length-us/ (last visited June 24, 2025)
Distribution of members in the United States House of Representatives from 1967 to 2023, by term length [Graph], Brookings Institution, November 24, 2024. [Online]. Available: https://www.statista.com/statistics/1361949/house-representatives-term-length-us/