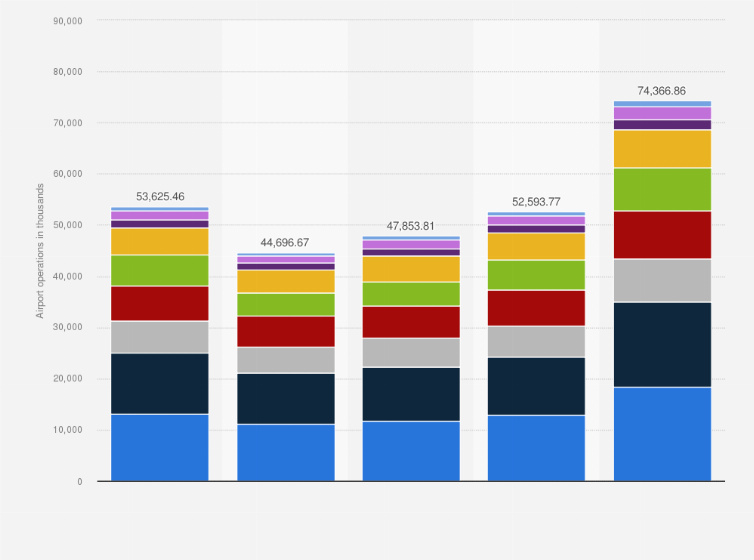
Most of the total airport operations in the United States were located in the Southern region of the country, which reported nearly 12.9 million operations in 2022. This volume is forecast to increase up to some 18.3 operations in 2050 as the U.S. airports are slowly rebounding from the dip recorded in 2020 amid the COVID-19 pandemic.
Advertisement
Advertisement
Airport operations at FAA towers and contract towers in each of the United States' regions between 2019 and 2020, with a 2050 forecast
(in 1,000s)
Adjust the presentation of the statistic and data points.
Share the statistic on social media channels or embed the statistic in your
website using "Embed Code", where available.
Cite this statistic and select one of the following formats: APA, Chicago, Harvard, MLA & Bluebook.
Print the statistic including description and metadata.
Chart type
Airport operations at FAA towers and contract towers in each of the United States' regions between 2019 and 2020, with a 2050 forecast
Share this statistic
You have no right to use this feature.
Make sure to contact us if you are interested in scientific citation.
You can upgrade your account to enable this functionality for all statistics.
This feature is not available with your current account.Request access
Learn more about how Statista can support your business.
Federal Aviation Administration. (March 1, 2023). Airport operations at FAA towers and contract towers in each of the United States' regions between 2019 and 2020, with a 2050 forecast (in 1,000s) [Graph]. In Statista. Retrieved July 12, 2025, from https://www.statista.com/statistics/1371075/us-operations-at-tower-airports-by-region/
Federal Aviation Administration. "Airport operations at FAA towers and contract towers in each of the United States' regions between 2019 and 2020, with a 2050 forecast (in 1,000s)." Chart. March 1, 2023. Statista. Accessed July 12, 2025. https://www.statista.com/statistics/1371075/us-operations-at-tower-airports-by-region/
Federal Aviation Administration. (2023). Airport operations at FAA towers and contract towers in each of the United States' regions between 2019 and 2020, with a 2050 forecast (in 1,000s). Statista. Statista Inc.. Accessed: July 12, 2025. https://www.statista.com/statistics/1371075/us-operations-at-tower-airports-by-region/
Federal Aviation Administration. "Airport Operations at Faa Towers and Contract Towers in Each of The United States' Regions between 2019 and 2020, with a 2050 Forecast (in 1,000s)." Statista, Statista Inc., 1 Mar 2023, https://www.statista.com/statistics/1371075/us-operations-at-tower-airports-by-region/
Federal Aviation Administration, Airport operations at FAA towers and contract towers in each of the United States' regions between 2019 and 2020, with a 2050 forecast (in 1,000s) Statista, https://www.statista.com/statistics/1371075/us-operations-at-tower-airports-by-region/ (last visited July 12, 2025)
Airport operations at FAA towers and contract towers in each of the United States' regions between 2019 and 2020, with a 2050 forecast (in 1,000s) [Graph], Federal Aviation Administration, March 1, 2023. [Online]. Available: https://www.statista.com/statistics/1371075/us-operations-at-tower-airports-by-region/
Advertisement
Profit from additional features with an Employee Account
Please create an employee account to be able to mark statistics as favorites.
Then you can access your favorite statistics via the star in the header.
Profit from the additional features of your individual account
Currently, you are using a shared account. To use individual functions (e.g., mark statistics as favourites, set
statistic alerts) please log in with your personal account.
If you are an admin, please authenticate by logging in again.