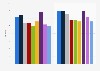
According to a survey conducted in Japan in 2021, women in their twenties on average spent *** minutes per day using their smartphones. The survey showed that women above the age of ** spent more time on watching television than on smartphone use, which was not the case for younger generations.
*The survey was conducted on October 18. Questionnaires were sent again so that those who did not answer in the first round could answer them on November 1.
Sample size of age groups:
10 to 19 years: n=95
20 to 29 years: n=75
30 to 39 years: n=129
40 to 49 years: n=199
50 to 59 years: n=238
60 to 69 years: n=195
70 years and above: n=292
Profit from the additional features of your individual account
Currently, you are using a shared account. To use individual functions (e.g., mark statistics as favourites, set
statistic alerts) please log in with your personal account.
If you are an admin, please authenticate by logging in again.
Learn more about how Statista can support your business.
NHK Broadcasting Culture Research Institute. (July 1, 2022). Average time women spent on using devices per day in Japan as of November 2021, by age group and type of device (in minutes) [Graph]. In Statista. Retrieved July 20, 2025, from https://www.statista.com/statistics/1371945/japan-average-time-women-spent-on-devices-per-day-by-age-group-and-type-of-device/
NHK Broadcasting Culture Research Institute. "Average time women spent on using devices per day in Japan as of November 2021, by age group and type of device (in minutes)." Chart. July 1, 2022. Statista. Accessed July 20, 2025. https://www.statista.com/statistics/1371945/japan-average-time-women-spent-on-devices-per-day-by-age-group-and-type-of-device/
NHK Broadcasting Culture Research Institute. (2022). Average time women spent on using devices per day in Japan as of November 2021, by age group and type of device (in minutes). Statista. Statista Inc.. Accessed: July 20, 2025. https://www.statista.com/statistics/1371945/japan-average-time-women-spent-on-devices-per-day-by-age-group-and-type-of-device/
NHK Broadcasting Culture Research Institute. "Average Time Women Spent on Using Devices per Day in Japan as of November 2021, by Age Group and Type of Device (in Minutes)." Statista, Statista Inc., 1 Jul 2022, https://www.statista.com/statistics/1371945/japan-average-time-women-spent-on-devices-per-day-by-age-group-and-type-of-device/
NHK Broadcasting Culture Research Institute, Average time women spent on using devices per day in Japan as of November 2021, by age group and type of device (in minutes) Statista, https://www.statista.com/statistics/1371945/japan-average-time-women-spent-on-devices-per-day-by-age-group-and-type-of-device/ (last visited July 20, 2025)
Average time women spent on using devices per day in Japan as of November 2021, by age group and type of device (in minutes) [Graph], NHK Broadcasting Culture Research Institute, July 1, 2022. [Online]. Available: https://www.statista.com/statistics/1371945/japan-average-time-women-spent-on-devices-per-day-by-age-group-and-type-of-device/