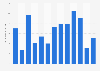
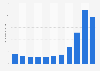
The United States had, by far, the highest homicide rate of the G7 countries between 2000 and 2023. In 2023, it reached 5.76 homicides per 100,000 inhabitants, a decrease from 6.78 in 2021. By comparison, Canada, the G7 nation with the second-highest homicide rate, had 1.98 homicides per 100,000 inhabitants in 2023. Out of each G7 nation, Japan had the lowest rate with 0.23 homicides per 100,000 inhabitants.
Advertisement
Advertisement
Homicide victims per 100,000 inhabitants of the G7 countries from 2000 to 2023, by country
Characteristic
Canada
France
Germany
Italy*
Japan
United Kingdom
United States**
2023
1.98
1.34
0.91
0.57
0.23
-
5.76
2022
2.27
1.24
0.82
0.54
0.23
-
6.51
2021
2.08
1.11
0.83
0.51
0.23
1.15
6.78
2020
2
1.05
0.94
0.48
0.25
0.93
6.35
2019
1.82
1.15
0.75
0.53
0.25
1.14
4.93
2018
1.78
1.06
0.95
0.6
0.26
1.08
4.89
2017
1.81
1.09
0.98
0.62
0.24
1.19
5.21
2016
1.69
1.2
1.16
0.67
0.28
1.18
5.29
2015
1.7
1.56
0.83
0.77
0.29
0.93
4.87
2014
1.47
1.22
0.88
0.78
0.31
0.88
4.38
2013
1.44
1.21
0.84
0.83
0.29
0.91
4.47
2012
1.57
1.22
0.81
0.88
0.34
0.96
4.68
2011
1.76
1.34
0.91
0.91
0.35
0.93
4.67
2010
1.63
1.26
0.98
0.88
0.36
1.14
4.73
2009
1.8
1.3
0.99
0.98
0.39
1.07
5
2008
1.84
1.63
1.02
1.03
0.51
1.16
5.4
2007
1.8
1.59
1.09
1.07
0.45
1.34
5.67
2006
1.86
1.42
1.21
1.06
0.48
1.32
5.79
2005
2.05
1.58
1.27
1.04
0.5
1.32
-
2004
1.95
1.62
1.35
-
0.55
1.46
-
2003
1.72
1.62
1.34
-
0.55
1.47
-
2002
1.85
1.85
1.43
1.12
0.52
1.79
5.65
2001
1.77
1.75
1.44
1.24
0.55
1.51
6.7
2000
1.77
1.77
1.67
1.34
0.53
1.46
5.54
Zoomable Statistic: Select the range in the chart you want to zoom in on.
Worldwide, Canada, France, Germany, Italy, Japan, United Kingdom, United States
Survey time period
2000 to 2023
Supplementary notes
The source collects data from the national authorities via the annual Untied Nations Crime Trends Survey (UN-CTS). Additional data is collected from other reliable sources.
* Numbers unavailable for 2003 and 2004.
** Numbers unavailable for 2003, 2004, and 2005.
Profit from the additional features of your individual account
Currently, you are using a shared account. To use individual functions (e.g., mark statistics as favourites, set
statistic alerts) please log in with your personal account.
If you are an admin, please authenticate by logging in again.
Learn more about how Statista can support your business.
UNODC. (May 8, 2024). Homicide victims per 100,000 inhabitants of the G7 countries from 2000 to 2023, by country [Graph]. In Statista. Retrieved July 12, 2025, from https://www.statista.com/statistics/1374211/g7-country-homicide-rate/
UNODC. "Homicide victims per 100,000 inhabitants of the G7 countries from 2000 to 2023, by country." Chart. May 8, 2024. Statista. Accessed July 12, 2025. https://www.statista.com/statistics/1374211/g7-country-homicide-rate/
UNODC. (2024). Homicide victims per 100,000 inhabitants of the G7 countries from 2000 to 2023, by country. Statista. Statista Inc.. Accessed: July 12, 2025. https://www.statista.com/statistics/1374211/g7-country-homicide-rate/
UNODC. "Homicide Victims per 100,000 Inhabitants of The G7 Countries from 2000 to 2023, by Country." Statista, Statista Inc., 8 May 2024, https://www.statista.com/statistics/1374211/g7-country-homicide-rate/
UNODC, Homicide victims per 100,000 inhabitants of the G7 countries from 2000 to 2023, by country Statista, https://www.statista.com/statistics/1374211/g7-country-homicide-rate/ (last visited July 12, 2025)
Homicide victims per 100,000 inhabitants of the G7 countries from 2000 to 2023, by country [Graph], UNODC, May 8, 2024. [Online]. Available: https://www.statista.com/statistics/1374211/g7-country-homicide-rate/