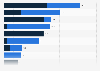
The annual value of export and import trade between the Association of Southeast Asian Nations (ASEAN) and China was expected to increase by *** billion constant U.S. dollars between 2023 and 2031. That was the largest trade revenue growth among regions worldwide. Furthermore, the value of trade between the European Union (EU) and the United States would increase by *** billion constant U.S. dollars over the same period. Trade between Russia and the EU was forecast to decline significantly as a result of the sanctions on Russia over its invasion of Ukraine, by *** billion constant U.S. dollars.
Africa refers to the countries of the African Continental Free Trade Agreement (AfCTA). The Association of Southeast Asian Nations (ASEAN) includes Brunei, Cambodia, Indonesia, Laos, Malaysia, Myanmar, the Philippines, Singapore, Thailand, and Vietnam. The Gulf Cooperation Council (GCC) includes Bahrain, Kuwait, Oman, Qatar, Saudi Arabia, and the United Arab Emirates. Mercosur includes Argentina, Brazil, Paraguay, and Uruguay.
Profit from the additional features of your individual account
Currently, you are using a shared account. To use individual functions (e.g., mark statistics as favourites, set
statistic alerts) please log in with your personal account.
If you are an admin, please authenticate by logging in again.
Learn more about how Statista can support your business.
BCG. (January 17, 2023). Estimated change in revenue from trade in goods between selected global regions in 2031 compared to 2023 (in billion constant U.S. dollars) [Graph]. In Statista. Retrieved June 26, 2025, from https://www.statista.com/statistics/1378887/change-in-trade-revenue-by-region/
BCG. "Estimated change in revenue from trade in goods between selected global regions in 2031 compared to 2023 (in billion constant U.S. dollars)." Chart. January 17, 2023. Statista. Accessed June 26, 2025. https://www.statista.com/statistics/1378887/change-in-trade-revenue-by-region/
BCG. (2023). Estimated change in revenue from trade in goods between selected global regions in 2031 compared to 2023 (in billion constant U.S. dollars). Statista. Statista Inc.. Accessed: June 26, 2025. https://www.statista.com/statistics/1378887/change-in-trade-revenue-by-region/
BCG. "Estimated Change in Revenue from Trade in Goods between Selected Global Regions in 2031 Compared to 2023 (in Billion Constant U.S. Dollars)." Statista, Statista Inc., 17 Jan 2023, https://www.statista.com/statistics/1378887/change-in-trade-revenue-by-region/
BCG, Estimated change in revenue from trade in goods between selected global regions in 2031 compared to 2023 (in billion constant U.S. dollars) Statista, https://www.statista.com/statistics/1378887/change-in-trade-revenue-by-region/ (last visited June 26, 2025)
Estimated change in revenue from trade in goods between selected global regions in 2031 compared to 2023 (in billion constant U.S. dollars) [Graph], BCG, January 17, 2023. [Online]. Available: https://www.statista.com/statistics/1378887/change-in-trade-revenue-by-region/