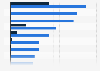
In 2023, Romania exported energy products worth 83.07 million U.S. dollars. The most significant value of exports was to Turkiye - over 47.13 million U.S. dollars, followed by Bulgaria - 14.96 million U.S. dollars.
Value of exported oils in Romania from 2022 to 2023, by country
(in 1,000 U.S. dollars)
You have no right to use this feature.
Make sure to contact us if you are interested in scientific citation.
You can upgrade your account to enable this functionality for all statistics.
This feature is not available with your current account.Request access
Product: 2707 Oils and other products of the distillation of high temperature coal tar; similar products in which the weight of the aromatic constituents exceeds that of the non-aromatic constituents
Learn more about how Statista can support your business.
Trade Map. (June 18, 2024). Value of exported oils in Romania from 2022 to 2023, by country (in 1,000 U.S. dollars) [Graph]. In Statista. Retrieved June 06, 2025, from https://www.statista.com/statistics/1385461/romania-value-of-exported-oils-by-country/
Trade Map. "Value of exported oils in Romania from 2022 to 2023, by country (in 1,000 U.S. dollars)." Chart. June 18, 2024. Statista. Accessed June 06, 2025. https://www.statista.com/statistics/1385461/romania-value-of-exported-oils-by-country/
Trade Map. (2024). Value of exported oils in Romania from 2022 to 2023, by country (in 1,000 U.S. dollars). Statista. Statista Inc.. Accessed: June 06, 2025. https://www.statista.com/statistics/1385461/romania-value-of-exported-oils-by-country/
Trade Map. "Value of Exported Oils in Romania from 2022 to 2023, by Country (in 1,000 U.S. Dollars)." Statista, Statista Inc., 18 Jun 2024, https://www.statista.com/statistics/1385461/romania-value-of-exported-oils-by-country/
Trade Map, Value of exported oils in Romania from 2022 to 2023, by country (in 1,000 U.S. dollars) Statista, https://www.statista.com/statistics/1385461/romania-value-of-exported-oils-by-country/ (last visited June 06, 2025)
Value of exported oils in Romania from 2022 to 2023, by country (in 1,000 U.S. dollars) [Graph], Trade Map, June 18, 2024. [Online]. Available: https://www.statista.com/statistics/1385461/romania-value-of-exported-oils-by-country/
Profit from additional features with an Employee Account
Please create an employee account to be able to mark statistics as favorites.
Then you can access your favorite statistics via the star in the header.
Profit from the additional features of your individual account
Currently, you are using a shared account. To use individual functions (e.g., mark statistics as favourites, set
statistic alerts) please log in with your personal account.
If you are an admin, please authenticate by logging in again.