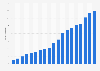
Klarna adoption for in-store payments in the Netherlands was higher in 2024 than it was in early 2020, signaling a growing use among consumers. This is according to two different questions asked throughout multiple surveys from Statista's Consumer Insights. The numbers shown here refer to the share of respondents who indicated they used Klarna in the past 12 months, either for POS transactions with a mobile device in stores and restaurants or for online shopping. ******* the respondents from the Netherlands indicated they had used Klarna in a POS setting between July 2023 and June 2024 - with four out of 10 respondents saying they used Klarna during this same time for online payments.
internet users; For this statistic, two sets of metrics are displayed: "Share of respondents who used payment services [since 2025] / used mobile payments or online payments [up to 2024]" and "Share of total respondents"
Method of interview
Online survey
Supplementary notes
The question was phrased by the source as follows: "Which payment services have you used in the past 12 months? (multi-pick)". In all editions before 2025, the source asked two questions - which were discontinued in 2025: "Which online payment services have you used in the past 12 months? (multi-pick)" and "Which of these services have you used in the past 12 months to pay in stores, restaurants or other points of sale with your smartphone? (multi-pick)".
The countries provided are part of the extended questionnaire within Statista's Global Consumer Survey, meaning there are no other countries with this same information. More information on the methodology can be found here.
For countries/territories receiving the extended questionnaire, the Global Consumer Survey utilizes a rolling survey system with four survey waves per year: The most recent data set contains the interviews of the last 12 months. This ensures trend stability and a higher number of interviews available for analysis, allowing you to adequately analyze smaller target groups, media, and brands.
Profit from the additional features of your individual account
Currently, you are using a shared account. To use individual functions (e.g., mark statistics as favourites, set
statistic alerts) please log in with your personal account.
If you are an admin, please authenticate by logging in again.
Learn more about how Statista can support your business.
Statista. (April 27, 2025). Klarna usage either for online payments or at POS in the Netherlands from 2019 to 1st quarter of 2025 [Graph]. In Statista. Retrieved June 22, 2025, from https://www.statista.com/statistics/1389585/klarna-adoption-in-the-netherlands/
Statista. "Klarna usage either for online payments or at POS in the Netherlands from 2019 to 1st quarter of 2025." Chart. April 27, 2025. Statista. Accessed June 22, 2025. https://www.statista.com/statistics/1389585/klarna-adoption-in-the-netherlands/
Statista. (2025). Klarna usage either for online payments or at POS in the Netherlands from 2019 to 1st quarter of 2025. Statista. Statista Inc.. Accessed: June 22, 2025. https://www.statista.com/statistics/1389585/klarna-adoption-in-the-netherlands/
Statista. "Klarna Usage Either for Online Payments or at Pos in The Netherlands from 2019 to 1st Quarter of 2025." Statista, Statista Inc., 27 Apr 2025, https://www.statista.com/statistics/1389585/klarna-adoption-in-the-netherlands/
Statista, Klarna usage either for online payments or at POS in the Netherlands from 2019 to 1st quarter of 2025 Statista, https://www.statista.com/statistics/1389585/klarna-adoption-in-the-netherlands/ (last visited June 22, 2025)
Klarna usage either for online payments or at POS in the Netherlands from 2019 to 1st quarter of 2025 [Graph], Statista, April 27, 2025. [Online]. Available: https://www.statista.com/statistics/1389585/klarna-adoption-in-the-netherlands/