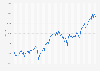
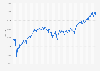
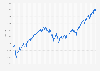
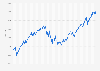
The S&P 100 index grew significantly since the financial crisis of 2008, year when it experienced the steepest decrease on record. Between the end of 2018 and the end of 2021, it jumped from 1,113.87 points to 1,709.17 points. As of the end of 2024, the S&P 100 index rose to 2,890.23 index points.
Annual development of the S&P 100 Index from 2000 to 2024
Profit from the additional features of your individual account
Currently, you are using a shared account. To use individual functions (e.g., mark statistics as favourites, set
statistic alerts) please log in with your personal account.
If you are an admin, please authenticate by logging in again.
Learn more about how Statista can support your business.
S&P Global. (February 28, 2025). Annual development of the S&P 100 Index from 2000 to 2024 [Graph]. In Statista. Retrieved June 04, 2025, from https://www.statista.com/statistics/1390296/sandp-100-index-annual-development/
S&P Global. "Annual development of the S&P 100 Index from 2000 to 2024." Chart. February 28, 2025. Statista. Accessed June 04, 2025. https://www.statista.com/statistics/1390296/sandp-100-index-annual-development/
S&P Global. (2025). Annual development of the S&P 100 Index from 2000 to 2024. Statista. Statista Inc.. Accessed: June 04, 2025. https://www.statista.com/statistics/1390296/sandp-100-index-annual-development/
S&P Global. "Annual Development of The S&p 100 Index from 2000 to 2024." Statista, Statista Inc., 28 Feb 2025, https://www.statista.com/statistics/1390296/sandp-100-index-annual-development/
S&P Global, Annual development of the S&P 100 Index from 2000 to 2024 Statista, https://www.statista.com/statistics/1390296/sandp-100-index-annual-development/ (last visited June 04, 2025)
Annual development of the S&P 100 Index from 2000 to 2024 [Graph], S&P Global, February 28, 2025. [Online]. Available: https://www.statista.com/statistics/1390296/sandp-100-index-annual-development/