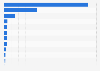
In 2023, approximately ** percent of entrepreneurial refugees had businesses in the food industry. Handicrafts was the second most chosen industry, with approximately ** percent of businesses. Fashion was third, with just under ***** percent of businesses.
Profit from the additional features of your individual account
Currently, you are using a shared account. To use individual functions (e.g., mark statistics as favourites, set
statistic alerts) please log in with your personal account.
If you are an admin, please authenticate by logging in again.
Learn more about how Statista can support your business.
Globo. (June 20, 2023). Share of refugee businesses in Brazil in 2023, by industry [Graph]. In Statista. Retrieved July 17, 2025, from https://www.statista.com/statistics/1396226/brazil-share-of-refugee-businesses/
Globo. "Share of refugee businesses in Brazil in 2023, by industry." Chart. June 20, 2023. Statista. Accessed July 17, 2025. https://www.statista.com/statistics/1396226/brazil-share-of-refugee-businesses/
Globo. (2023). Share of refugee businesses in Brazil in 2023, by industry. Statista. Statista Inc.. Accessed: July 17, 2025. https://www.statista.com/statistics/1396226/brazil-share-of-refugee-businesses/
Globo. "Share of Refugee Businesses in Brazil in 2023, by Industry." Statista, Statista Inc., 20 Jun 2023, https://www.statista.com/statistics/1396226/brazil-share-of-refugee-businesses/
Globo, Share of refugee businesses in Brazil in 2023, by industry Statista, https://www.statista.com/statistics/1396226/brazil-share-of-refugee-businesses/ (last visited July 17, 2025)
Share of refugee businesses in Brazil in 2023, by industry [Graph], Globo, June 20, 2023. [Online]. Available: https://www.statista.com/statistics/1396226/brazil-share-of-refugee-businesses/