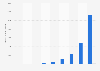
According to a survey conducted from August 20 to September 16, 2024, approximately 22 percent of adults in the United States aged 40 and 49 years had experienced Long COVID. This statistic shows the percentage of all adults in the United States who ever had Long COVID from August 20 to September 16, 2024, by age group.
Advertisement
Advertisement
Percentage of all adults in the United States who ever had Long COVID from August 20 to September 16, 2024, by age group
Characteristic
Share of adults
18 - 29 years
18.4%
30 - 39 years
18.5%
40 - 49 years
22.2%
50 - 59 years
21.2%
60 - 69 years
14.9%
70 - 79 years
11.3%
80 years and older
14%
Total
17.9%
0%5%10%15%20%25%
Add this content to your personal favorites. These can be accessed from the favorites menu in the main navigation.
You have no right to use this feature.
Make sure to contact us if you are interested in scientific citation.
You can upgrade your account to enable this functionality for all statistics.
This feature is not available with your current account.Request access
Learn more about how Statista can support your business.
CDC. (October 3, 2024). Percentage of all adults in the United States who ever had Long COVID from August 20 to September 16, 2024, by age group [Graph]. In Statista. Retrieved June 18, 2025, from https://www.statista.com/statistics/1401918/percentage-of-all-adults-who-ever-had-long-covid-in-the-us-by-age-group/
CDC. "Percentage of all adults in the United States who ever had Long COVID from August 20 to September 16, 2024, by age group." Chart. October 3, 2024. Statista. Accessed June 18, 2025. https://www.statista.com/statistics/1401918/percentage-of-all-adults-who-ever-had-long-covid-in-the-us-by-age-group/
CDC. (2024). Percentage of all adults in the United States who ever had Long COVID from August 20 to September 16, 2024, by age group. Statista. Statista Inc.. Accessed: June 18, 2025. https://www.statista.com/statistics/1401918/percentage-of-all-adults-who-ever-had-long-covid-in-the-us-by-age-group/
CDC. "Percentage of All Adults in The United States Who Ever Had Long Covid from August 20 to September 16, 2024, by Age Group." Statista, Statista Inc., 3 Oct 2024, https://www.statista.com/statistics/1401918/percentage-of-all-adults-who-ever-had-long-covid-in-the-us-by-age-group/
CDC, Percentage of all adults in the United States who ever had Long COVID from August 20 to September 16, 2024, by age group Statista, https://www.statista.com/statistics/1401918/percentage-of-all-adults-who-ever-had-long-covid-in-the-us-by-age-group/ (last visited June 18, 2025)
Percentage of all adults in the United States who ever had Long COVID from August 20 to September 16, 2024, by age group [Graph], CDC, October 3, 2024. [Online]. Available: https://www.statista.com/statistics/1401918/percentage-of-all-adults-who-ever-had-long-covid-in-the-us-by-age-group/
Advertisement
Profit from additional features with an Employee Account
Please create an employee account to be able to mark statistics as favorites.
Then you can access your favorite statistics via the star in the header.
Profit from the additional features of your individual account
Currently, you are using a shared account. To use individual functions (e.g., mark statistics as favourites, set
statistic alerts) please log in with your personal account.
If you are an admin, please authenticate by logging in again.