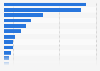
Carnival Corporation & plc's greenhouse gas (GHG) emissions were 9.5 million metric tons of carbon dioxide equivalent (MtCO₂e) in financial year 2023, a year-on-year increase of 12 percent. Carnival's GHG emissions fell notably in 2020 due to the outbreak of COVID-19, and fell further in 2021. Although emissions have rebounded since then, they remain below pre-pandemic levels. Carnival Corporation & plc was the most polluting cruise company sailing on European routes in 2022.
Carnival Corporation & plc is the largest cruise company in the world, with a portfolio of several cruise lines including P&O Cruises, Costa Cruises, and AIDA Cruises.
Advertisement
Advertisement
Greenhouse gas (GHG) emissions of Carnival Corporation & plc worldwide from 2019 to 2023
(in million metric tons of carbon dioxide equivalent)
Profit from the additional features of your individual account
Currently, you are using a shared account. To use individual functions (e.g., mark statistics as favourites, set
statistic alerts) please log in with your personal account.
If you are an admin, please authenticate by logging in again.
Learn more about how Statista can support your business.
Carnival Corp.. (April 5, 2024). Greenhouse gas (GHG) emissions of Carnival Corporation & plc worldwide from 2019 to 2023 (in million metric tons of carbon dioxide equivalent) [Graph]. In Statista. Retrieved June 24, 2025, from https://www.statista.com/statistics/1404444/emissions-of-carnival-corp-plc-worldwide/
Carnival Corp.. "Greenhouse gas (GHG) emissions of Carnival Corporation & plc worldwide from 2019 to 2023 (in million metric tons of carbon dioxide equivalent)." Chart. April 5, 2024. Statista. Accessed June 24, 2025. https://www.statista.com/statistics/1404444/emissions-of-carnival-corp-plc-worldwide/
Carnival Corp.. (2024). Greenhouse gas (GHG) emissions of Carnival Corporation & plc worldwide from 2019 to 2023 (in million metric tons of carbon dioxide equivalent). Statista. Statista Inc.. Accessed: June 24, 2025. https://www.statista.com/statistics/1404444/emissions-of-carnival-corp-plc-worldwide/
Carnival Corp.. "Greenhouse Gas (Ghg) Emissions of Carnival Corporation & Plc Worldwide from 2019 to 2023 (in Million Metric Tons of Carbon Dioxide Equivalent)." Statista, Statista Inc., 5 Apr 2024, https://www.statista.com/statistics/1404444/emissions-of-carnival-corp-plc-worldwide/
Carnival Corp., Greenhouse gas (GHG) emissions of Carnival Corporation & plc worldwide from 2019 to 2023 (in million metric tons of carbon dioxide equivalent) Statista, https://www.statista.com/statistics/1404444/emissions-of-carnival-corp-plc-worldwide/ (last visited June 24, 2025)
Greenhouse gas (GHG) emissions of Carnival Corporation & plc worldwide from 2019 to 2023 (in million metric tons of carbon dioxide equivalent) [Graph], Carnival Corp., April 5, 2024. [Online]. Available: https://www.statista.com/statistics/1404444/emissions-of-carnival-corp-plc-worldwide/