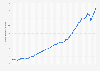
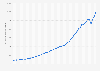
Power sector emissions in India surged seven percent in 2023, to a high of 1.4 billion metric tons of carbon dioxide equivalent (GtCO₂). The increase in energy demand driven by rapid economic growth has seen India’s power sector emissions more than triple since the turn of the century to become the third-highest worldwide.
The role of coal
The dramatic rise in India’s power sector emissions is a result of the country’s increased use of coal as a power source. Coal – the dirtiest of fossil fuels – accounted for around 95 percent of the sectors’ emissions in 2023. It is the primary source of electricity generation in India, accounting for around three-quarters in 2023.
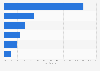
Most polluting power plants in India
In 2023, seven of the 10 biggest emitters in India were coal-fired power plants. The most polluting was the Vindhyachal Super Thermal Power Station, which produced 26 GtCO₂. was the Vindhyachal Super Thermal Power Station, which produced 26 GtCO₂. The plant is located in the state of Uttar Pradesh, which generated India’s second-highest power-related emissions in 2023.
Power sector emissions in India from 2000 to 2023, by source
(in million metric tons of carbon dioxide equivalent)
Figures aim to include full lifecycle emissions including upstream methane, supply-chain and manufacturing emissions, and include all gases, converted into CO₂ equivalent over a 100 year timescale.
*Other fossil includes generation from oil and petroleum products, as well as manufactured gases and waste.
Profit from the additional features of your individual account
Currently, you are using a shared account. To use individual functions (e.g., mark statistics as favourites, set
statistic alerts) please log in with your personal account.
If you are an admin, please authenticate by logging in again.
Learn more about how Statista can support your business.
Ember. (July 3, 2024). Power sector emissions in India from 2000 to 2023, by source (in million metric tons of carbon dioxide equivalent) [Graph]. In Statista. Retrieved June 07, 2025, from https://www.statista.com/statistics/1405577/power-sector-emissions-india-by-source/
Ember. "Power sector emissions in India from 2000 to 2023, by source (in million metric tons of carbon dioxide equivalent)." Chart. July 3, 2024. Statista. Accessed June 07, 2025. https://www.statista.com/statistics/1405577/power-sector-emissions-india-by-source/
Ember. (2024). Power sector emissions in India from 2000 to 2023, by source (in million metric tons of carbon dioxide equivalent). Statista. Statista Inc.. Accessed: June 07, 2025. https://www.statista.com/statistics/1405577/power-sector-emissions-india-by-source/
Ember. "Power Sector Emissions in India from 2000 to 2023, by Source (in Million Metric Tons of Carbon Dioxide Equivalent)." Statista, Statista Inc., 3 Jul 2024, https://www.statista.com/statistics/1405577/power-sector-emissions-india-by-source/
Ember, Power sector emissions in India from 2000 to 2023, by source (in million metric tons of carbon dioxide equivalent) Statista, https://www.statista.com/statistics/1405577/power-sector-emissions-india-by-source/ (last visited June 07, 2025)
Power sector emissions in India from 2000 to 2023, by source (in million metric tons of carbon dioxide equivalent) [Graph], Ember, July 3, 2024. [Online]. Available: https://www.statista.com/statistics/1405577/power-sector-emissions-india-by-source/