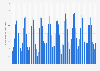
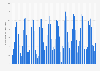
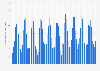
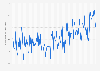
In 2024, the mean sea surface temperature in Australia was 0.89 degrees Celsius higher than the reference value for that year, indicating a positive anomaly. Over the course of the last century, mean sea surface temperature anomaly measurements in Australia have exhibited an overall increasing trend.
Advertisement
Advertisement
Annual mean sea surface temperature deviation in Australia from 1910 to 2024
(in degrees Celsius)
Characteristic
Mean deviation in degrees Celsius
2024
0.89
2023
0.54
2022
0.8
2021
0.52
2020
0.6
2019
0.32
2018
0.45
2017
0.49
2016
0.78
2015
0.52
2014
0.51
2013
0.59
2012
0.47
2011
0.5
2010
0.66
2009
0.4
2008
0.3
2007
0.32
2006
0.15
2005
0.36
2004
0.18
2003
0.33
2002
0.35
2001
0.38
2000
0.33
1999
0.43
1998
0.6
1997
0.07
1996
0.26
1995
0.19
1994
-0.02
1993
-0.09
1992
0.05
1991
0.03
1990
0.29
1989
0.39
1988
0.46
1987
0.03
1986
0.02
1985
0.22
1984
0.16
1983
0.2
1982
-0.15
1981
0.09
1980
0.01
1979
0.04
1978
0.12
1977
-0.08
1976
-0.07
1975
0.08
1974
0.02
1973
0.21
1972
-0.13
1971
-0.05
1970
0.09
1969
-0.07
1968
-0.35
1967
-0.26
1966
-0.37
1965
-0.5
1964
-0.19
1963
-0.14
1962
0.04
1961
-0.12
1960
-0.16
1959
-0.05
1958
-0.07
1957
-0.3
1956
-0.15
1955
-0.25
1954
-0.37
1953
-0.41
1952
-0.34
1951
-0.4
1950
-0.09
1949
-0.45
1948
-0.43
1947
-0.46
1946
-0.31
1945
0.05
1944
-0.11
1943
-0.08
1942
0.01
1941
-0.08
1940
-0.34
1939
-0.42
1938
-0.13
1937
-0.44
1936
-0.39
1935
-0.46
1934
-0.37
1933
-0.38
1932
-0.45
1931
-0.39
1930
-0.58
1929
-0.68
1928
-0.3
1927
-0.47
1926
-0.46
1925
-0.59
1924
-0.28
1923
-0.49
1922
-0.28
1921
-0.08
1920
-0.29
1919
-0.48
1918
-0.28
1917
-0.3
1916
-0.2
1915
-0.18
1914
-0.4
1913
-0.59
1912
-0.43
1911
-0.49
1910
-0.34
Zoomable Statistic: Select the range in the chart you want to zoom in on.
Profit from the additional features of your individual account
Currently, you are using a shared account. To use individual functions (e.g., mark statistics as favourites, set
statistic alerts) please log in with your personal account.
If you are an admin, please authenticate by logging in again.
Learn more about how Statista can support your business.
Bureau of Meteorology (Australia). (February 6, 2025). Annual mean sea surface temperature deviation in Australia from 1910 to 2024 (in degrees Celsius) [Graph]. In Statista. Retrieved July 25, 2025, from https://www.statista.com/statistics/1406028/australia-annual-sea-surface-temperature-anomaly/
Bureau of Meteorology (Australia). "Annual mean sea surface temperature deviation in Australia from 1910 to 2024 (in degrees Celsius)." Chart. February 6, 2025. Statista. Accessed July 25, 2025. https://www.statista.com/statistics/1406028/australia-annual-sea-surface-temperature-anomaly/
Bureau of Meteorology (Australia). (2025). Annual mean sea surface temperature deviation in Australia from 1910 to 2024 (in degrees Celsius). Statista. Statista Inc.. Accessed: July 25, 2025. https://www.statista.com/statistics/1406028/australia-annual-sea-surface-temperature-anomaly/
Bureau of Meteorology (Australia). "Annual Mean Sea Surface Temperature Deviation in Australia from 1910 to 2024 (in Degrees Celsius)." Statista, Statista Inc., 6 Feb 2025, https://www.statista.com/statistics/1406028/australia-annual-sea-surface-temperature-anomaly/
Bureau of Meteorology (Australia), Annual mean sea surface temperature deviation in Australia from 1910 to 2024 (in degrees Celsius) Statista, https://www.statista.com/statistics/1406028/australia-annual-sea-surface-temperature-anomaly/ (last visited July 25, 2025)
Annual mean sea surface temperature deviation in Australia from 1910 to 2024 (in degrees Celsius) [Graph], Bureau of Meteorology (Australia), February 6, 2025. [Online]. Available: https://www.statista.com/statistics/1406028/australia-annual-sea-surface-temperature-anomaly/