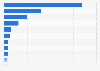
In 2024, Grindr Inc. generated around 208.59 million U.S. dollars worth of revenues in North America. Revenues generated in Europe amounted to around 83.37 million U.S. dollars, while profits from other countries and regions of the world amounted to around 52.69 million U.S. dollars.
Advertisement
Advertisement
Annual revenue generated by Grindr Inc. in 2021 and 2024, by region
(in million U.S. dollars)
Throughout its first informed financial years, Grindr has changed how it informs its regional revenues. This information is hereby displayed by merging the informed revenues of countries into those of larger regions, to follow the value of the company's annual revenues.
In 2022, earnings in the United Kingdom were informed as 14.34 million U.S. dollars. By being merged into Europe's, this changed the values of 2022 for revenues originating from the rest of the world. For the financial report of that year, the informed revenues for the rest of the world amounted to 58.178 million U.S. dollars, whereas in the 2023 report, they were reported as 25.557 million U.S. dollars.
In 2024, values for the United States were merged with Canada's and integrated into North America. During the years 2023 and 2024, revenue from the U.S., the company's country of domicile, amounted to 151.53 million U.S. dollars and 199.26 million U.S. dollars, respectively.
Profit from the additional features of your individual account
Currently, you are using a shared account. To use individual functions (e.g., mark statistics as favourites, set
statistic alerts) please log in with your personal account.
If you are an admin, please authenticate by logging in again.
Learn more about how Statista can support your business.
Grindr. (March 7, 2025). Annual revenue generated by Grindr Inc. in 2021 and 2024, by region (in million U.S. dollars) [Graph]. In Statista. Retrieved June 28, 2025, from https://www.statista.com/statistics/1412124/grindr-regional-revenue/
Grindr. "Annual revenue generated by Grindr Inc. in 2021 and 2024, by region (in million U.S. dollars)." Chart. March 7, 2025. Statista. Accessed June 28, 2025. https://www.statista.com/statistics/1412124/grindr-regional-revenue/
Grindr. (2025). Annual revenue generated by Grindr Inc. in 2021 and 2024, by region (in million U.S. dollars). Statista. Statista Inc.. Accessed: June 28, 2025. https://www.statista.com/statistics/1412124/grindr-regional-revenue/
Grindr. "Annual Revenue Generated by Grindr Inc. in 2021 and 2024, by Region (in Million U.S. Dollars)." Statista, Statista Inc., 7 Mar 2025, https://www.statista.com/statistics/1412124/grindr-regional-revenue/
Grindr, Annual revenue generated by Grindr Inc. in 2021 and 2024, by region (in million U.S. dollars) Statista, https://www.statista.com/statistics/1412124/grindr-regional-revenue/ (last visited June 28, 2025)
Annual revenue generated by Grindr Inc. in 2021 and 2024, by region (in million U.S. dollars) [Graph], Grindr, March 7, 2025. [Online]. Available: https://www.statista.com/statistics/1412124/grindr-regional-revenue/