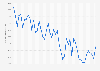
Greenland's ice mass has seen an overall decrease since 2002, despite some fluctuation. As of February 2025, the ice mass in Greenland had dropped by over**** trillion metric tons in comparison to April 16, 2002. This represented a loss rate of some *** billion metric tons per year. Antarctica's ice mass has followed a similar trend over the same period of time.
Profit from the additional features of your individual account
Currently, you are using a shared account. To use individual functions (e.g., mark statistics as favourites, set
statistic alerts) please log in with your personal account.
If you are an admin, please authenticate by logging in again.
Learn more about how Statista can support your business.
NASA. (May 12, 2025). Ice mass change in Greenland from 2002 to 2025 (in billion metric tons) [Graph]. In Statista. Retrieved July 12, 2025, from https://www.statista.com/statistics/1412752/ice-mass-change-greenland-timeline/
NASA. "Ice mass change in Greenland from 2002 to 2025 (in billion metric tons)." Chart. May 12, 2025. Statista. Accessed July 12, 2025. https://www.statista.com/statistics/1412752/ice-mass-change-greenland-timeline/
NASA. (2025). Ice mass change in Greenland from 2002 to 2025 (in billion metric tons). Statista. Statista Inc.. Accessed: July 12, 2025. https://www.statista.com/statistics/1412752/ice-mass-change-greenland-timeline/
NASA. "Ice Mass Change in Greenland from 2002 to 2025 (in Billion Metric Tons)." Statista, Statista Inc., 12 May 2025, https://www.statista.com/statistics/1412752/ice-mass-change-greenland-timeline/
NASA, Ice mass change in Greenland from 2002 to 2025 (in billion metric tons) Statista, https://www.statista.com/statistics/1412752/ice-mass-change-greenland-timeline/ (last visited July 12, 2025)
Ice mass change in Greenland from 2002 to 2025 (in billion metric tons) [Graph], NASA, May 12, 2025. [Online]. Available: https://www.statista.com/statistics/1412752/ice-mass-change-greenland-timeline/