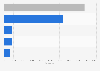
According to a survey conducted in South Korea between 2021 and 2022, around ** percent of respondents stated that they had injected drugs. This included both intravenous and non-intravenous injections.
Profit from the additional features of your individual account
Currently, you are using a shared account. To use individual functions (e.g., mark statistics as favourites, set
statistic alerts) please log in with your personal account.
If you are an admin, please authenticate by logging in again.
Learn more about how Statista can support your business.
National Center for Mental Health. (June 28, 2023). Share of drug users who inject in South Korea as of April 2022 [Graph]. In Statista. Retrieved July 15, 2025, from https://www.statista.com/statistics/1414616/south-korea-injection-drug-use-rate/
National Center for Mental Health. "Share of drug users who inject in South Korea as of April 2022." Chart. June 28, 2023. Statista. Accessed July 15, 2025. https://www.statista.com/statistics/1414616/south-korea-injection-drug-use-rate/
National Center for Mental Health. (2023). Share of drug users who inject in South Korea as of April 2022. Statista. Statista Inc.. Accessed: July 15, 2025. https://www.statista.com/statistics/1414616/south-korea-injection-drug-use-rate/
National Center for Mental Health. "Share of Drug Users Who Inject in South Korea as of April 2022." Statista, Statista Inc., 28 Jun 2023, https://www.statista.com/statistics/1414616/south-korea-injection-drug-use-rate/
National Center for Mental Health, Share of drug users who inject in South Korea as of April 2022 Statista, https://www.statista.com/statistics/1414616/south-korea-injection-drug-use-rate/ (last visited July 15, 2025)
Share of drug users who inject in South Korea as of April 2022 [Graph], National Center for Mental Health, June 28, 2023. [Online]. Available: https://www.statista.com/statistics/1414616/south-korea-injection-drug-use-rate/