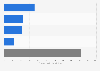
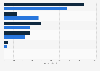
In 2022, the sewage production cost per 1,000 liters in South Korea has been recorded at around ***** South Korean won. It increased by approximately *** won compared to the value of ***** won in 2012.
Profit from the additional features of your individual account
Currently, you are using a shared account. To use individual functions (e.g., mark statistics as favourites, set
statistic alerts) please log in with your personal account.
If you are an admin, please authenticate by logging in again.
Learn more about how Statista can support your business.
ME (South Korea). (August 9, 2024). Sewage production cost per 1.000 liters in South Korea from 2012 to 2022 (in South Korean won) [Graph]. In Statista. Retrieved July 12, 2025, from https://www.statista.com/statistics/1417260/south-korea-sewage-production-cost/
ME (South Korea). "Sewage production cost per 1.000 liters in South Korea from 2012 to 2022 (in South Korean won) ." Chart. August 9, 2024. Statista. Accessed July 12, 2025. https://www.statista.com/statistics/1417260/south-korea-sewage-production-cost/
ME (South Korea). (2024). Sewage production cost per 1.000 liters in South Korea from 2012 to 2022 (in South Korean won) . Statista. Statista Inc.. Accessed: July 12, 2025. https://www.statista.com/statistics/1417260/south-korea-sewage-production-cost/
ME (South Korea). "Sewage Production Cost per 1.000 Liters in South Korea from 2012 to 2022 (in South Korean Won) ." Statista, Statista Inc., 9 Aug 2024, https://www.statista.com/statistics/1417260/south-korea-sewage-production-cost/
ME (South Korea), Sewage production cost per 1.000 liters in South Korea from 2012 to 2022 (in South Korean won) Statista, https://www.statista.com/statistics/1417260/south-korea-sewage-production-cost/ (last visited July 12, 2025)
Sewage production cost per 1.000 liters in South Korea from 2012 to 2022 (in South Korean won) [Graph], ME (South Korea), August 9, 2024. [Online]. Available: https://www.statista.com/statistics/1417260/south-korea-sewage-production-cost/