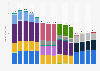
Global server shipments grew 4.8 percent in 2022 to around 13.6 million. Slower growth of 1.5 percent is expected in 2023, with extended server refresh cycles at large cloud providers among the driving factors.
Profit from the additional features of your individual account
Currently, you are using a shared account. To use individual functions (e.g., mark statistics as favourites, set
statistic alerts) please log in with your personal account.
If you are an admin, please authenticate by logging in again.
Learn more about how Statista can support your business.
MIC. (August 28, 2023). Volume of server shipments worldwide from 2018 to 2022, with a forecast until 2027 (in thousands) [Graph]. In Statista. Retrieved June 05, 2025, from https://www.statista.com/statistics/1417940/global-server-shipments/
MIC. "Volume of server shipments worldwide from 2018 to 2022, with a forecast until 2027 (in thousands)." Chart. August 28, 2023. Statista. Accessed June 05, 2025. https://www.statista.com/statistics/1417940/global-server-shipments/
MIC. (2023). Volume of server shipments worldwide from 2018 to 2022, with a forecast until 2027 (in thousands). Statista. Statista Inc.. Accessed: June 05, 2025. https://www.statista.com/statistics/1417940/global-server-shipments/
MIC. "Volume of Server Shipments Worldwide from 2018 to 2022, with a Forecast until 2027 (in Thousands)." Statista, Statista Inc., 28 Aug 2023, https://www.statista.com/statistics/1417940/global-server-shipments/
MIC, Volume of server shipments worldwide from 2018 to 2022, with a forecast until 2027 (in thousands) Statista, https://www.statista.com/statistics/1417940/global-server-shipments/ (last visited June 05, 2025)
Volume of server shipments worldwide from 2018 to 2022, with a forecast until 2027 (in thousands) [Graph], MIC, August 28, 2023. [Online]. Available: https://www.statista.com/statistics/1417940/global-server-shipments/