In 2023/24, the crime rate in Liverpool was 100.8 crimes per 1,000 people, compared with 199 in the previous year. Between 2015 and 2023, the crime rate steadily increased in every reporting year, with the exception of 2021/21, which was due to the impact of the COVID-19 pandemic.
Advertisement
Advertisement
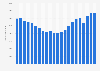
Crime rate per 1,000 population in Liverpool / Merseyside from 2015/16 to 2023/24
Characteristic
Crimes per 1,000 population
2023/24
100.8
2022/23
119
2021/22
115.6
2020/21
90.2
2019/20
96.7
2018/19
95.3
2017/18
88.9
2016/17
78.8
2015/16
73.7
708090100110120130
Add this content to your personal favorites. These can be accessed from the favorites menu in the main navigation.
You have no right to use this feature.
Make sure to contact us if you are interested in scientific citation.
You can upgrade your account to enable this functionality for all statistics.
This feature is not available with your current account.Request access
Learn more about how Statista can support your business.
Office for National Statistics (UK). (July 24, 2024). Crime rate per 1,000 population in Liverpool / Merseyside from 2015/16 to 2023/24 [Graph]. In Statista. Retrieved July 23, 2025, from https://www.statista.com/statistics/1428696/liverpool-crime-rate/
Office for National Statistics (UK). "Crime rate per 1,000 population in Liverpool / Merseyside from 2015/16 to 2023/24." Chart. July 24, 2024. Statista. Accessed July 23, 2025. https://www.statista.com/statistics/1428696/liverpool-crime-rate/
Office for National Statistics (UK). (2024). Crime rate per 1,000 population in Liverpool / Merseyside from 2015/16 to 2023/24. Statista. Statista Inc.. Accessed: July 23, 2025. https://www.statista.com/statistics/1428696/liverpool-crime-rate/
Office for National Statistics (UK). "Crime Rate per 1,000 Population in Liverpool / Merseyside from 2015/16 to 2023/24." Statista, Statista Inc., 24 Jul 2024, https://www.statista.com/statistics/1428696/liverpool-crime-rate/
Office for National Statistics (UK), Crime rate per 1,000 population in Liverpool / Merseyside from 2015/16 to 2023/24 Statista, https://www.statista.com/statistics/1428696/liverpool-crime-rate/ (last visited July 23, 2025)
Crime rate per 1,000 population in Liverpool / Merseyside from 2015/16 to 2023/24 [Graph], Office for National Statistics (UK), July 24, 2024. [Online]. Available: https://www.statista.com/statistics/1428696/liverpool-crime-rate/
Advertisement
Profit from additional features with an Employee Account
Please create an employee account to be able to mark statistics as favorites.
Then you can access your favorite statistics via the star in the header.
Profit from the additional features of your individual account
Currently, you are using a shared account. To use individual functions (e.g., mark statistics as favourites, set
statistic alerts) please log in with your personal account.
If you are an admin, please authenticate by logging in again.