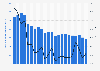
The United States contributed roughly 17 percent of global warming from 1851 to 2023. By contrast, India contributed five percent of warming during this period, despite the country having a far larger population than the United States. In total, G20 countries have contributed approximately three-quarters of global warming to date, while the least developed countries are responsible for just six percent.
Advertisement
Advertisement
Distribution of historic contributions to global warming worldwide from 1851 to 2023, by country or region
Historic contributions are shown as a country or region's share of the global mean surface temperature change as a result of its cumulative emissions of three gases – carbon dioxide, methane, and nitrous oxide. Figures for the rest of G20 and rest of world were calculated by Statista using source data.
Profit from the additional features of your individual account
Currently, you are using a shared account. To use individual functions (e.g., mark statistics as favourites, set
statistic alerts) please log in with your personal account.
If you are an admin, please authenticate by logging in again.
Learn more about how Statista can support your business.
OWID, & Statista. (November 21, 2024). Distribution of historic contributions to global warming worldwide from 1851 to 2023, by country or region [Graph]. In Statista. Retrieved July 14, 2025, from https://www.statista.com/statistics/1440280/historic-contributions-to-global-warming-worldwide-by-country/
OWID, und Statista. "Distribution of historic contributions to global warming worldwide from 1851 to 2023, by country or region." Chart. November 21, 2024. Statista. Accessed July 14, 2025. https://www.statista.com/statistics/1440280/historic-contributions-to-global-warming-worldwide-by-country/
OWID, Statista. (2024). Distribution of historic contributions to global warming worldwide from 1851 to 2023, by country or region. Statista. Statista Inc.. Accessed: July 14, 2025. https://www.statista.com/statistics/1440280/historic-contributions-to-global-warming-worldwide-by-country/
OWID, and Statista. "Distribution of Historic Contributions to Global Warming Worldwide from 1851 to 2023, by Country or Region." Statista, Statista Inc., 21 Nov 2024, https://www.statista.com/statistics/1440280/historic-contributions-to-global-warming-worldwide-by-country/
OWID & Statista, Distribution of historic contributions to global warming worldwide from 1851 to 2023, by country or region Statista, https://www.statista.com/statistics/1440280/historic-contributions-to-global-warming-worldwide-by-country/ (last visited July 14, 2025)
Distribution of historic contributions to global warming worldwide from 1851 to 2023, by country or region [Graph], OWID, & Statista, November 21, 2024. [Online]. Available: https://www.statista.com/statistics/1440280/historic-contributions-to-global-warming-worldwide-by-country/