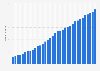
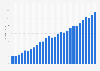
In 2022, the average daily TV viewing time in the U.S. amounted to around three hours. While traditional TV is declining in popularity, the time spent watching apps on connected TV devices is growing.
Profit from the additional features of your individual account
Currently, you are using a shared account. To use individual functions (e.g., mark statistics as favourites, set
statistic alerts) please log in with your personal account.
If you are an admin, please authenticate by logging in again.
Learn more about how Statista can support your business.
Statista. (January 9, 2024). Average daily time spent watching TV and connected TV in the United States from 2019 to 2024 (in minutes) [Graph]. In Statista. Retrieved June 06, 2025, from https://www.statista.com/statistics/1440758/tv-ctv-viewing-time-us/
Statista. "Average daily time spent watching TV and connected TV in the United States from 2019 to 2024 (in minutes)." Chart. January 9, 2024. Statista. Accessed June 06, 2025. https://www.statista.com/statistics/1440758/tv-ctv-viewing-time-us/
Statista. (2024). Average daily time spent watching TV and connected TV in the United States from 2019 to 2024 (in minutes). Statista. Statista Inc.. Accessed: June 06, 2025. https://www.statista.com/statistics/1440758/tv-ctv-viewing-time-us/
Statista. "Average Daily Time Spent Watching Tv and Connected Tv in The United States from 2019 to 2024 (in Minutes)." Statista, Statista Inc., 9 Jan 2024, https://www.statista.com/statistics/1440758/tv-ctv-viewing-time-us/
Statista, Average daily time spent watching TV and connected TV in the United States from 2019 to 2024 (in minutes) Statista, https://www.statista.com/statistics/1440758/tv-ctv-viewing-time-us/ (last visited June 06, 2025)
Average daily time spent watching TV and connected TV in the United States from 2019 to 2024 (in minutes) [Graph], Statista, January 9, 2024. [Online]. Available: https://www.statista.com/statistics/1440758/tv-ctv-viewing-time-us/