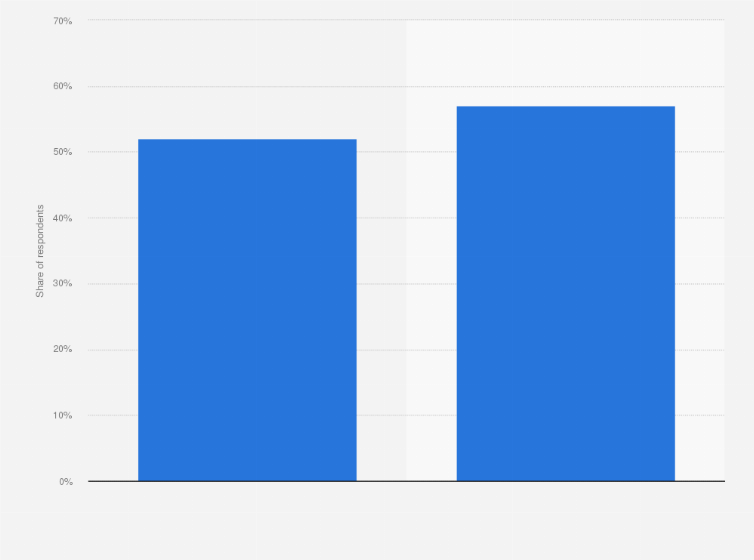
According to a 2023 survey, user generated content and social video were the favorite type of video content consumed by 57 percent of male users in the United States. In comparison, 52 percent of female respondents reported that social video and short video content were their favorite type of video content to consume.
Share of viewers in the United States who enjoyed watching user generated and social video the most in 2023, by gender
Adjust the presentation of the statistic and data points.
Share the statistic on social media channels or embed the statistic in your
website using "Embed Code", where available.
Cite this statistic and select one of the following formats: APA, Chicago, Harvard, MLA & Bluebook.
Print the statistic including description and metadata.
Chart type
Share of viewers in the United States who enjoyed watching user generated and social video the most in 2023, by gender
Share this statistic
You have no right to use this feature.
Make sure to contact us if you are interested in scientific citation.
You can upgrade your account to enable this functionality for all statistics.
This feature is not available with your current account.Request access
Learn more about how Statista can support your business.
InMobi. (August 1, 2023). Share of viewers in the United States who enjoyed watching user generated and social video the most in 2023, by gender [Graph]. In Statista. Retrieved May 05, 2025, from https://www.statista.com/statistics/1445841/us-viewers-enjoying-social-video-the-most-by-gender/
InMobi. "Share of viewers in the United States who enjoyed watching user generated and social video the most in 2023, by gender." Chart. August 1, 2023. Statista. Accessed May 05, 2025. https://www.statista.com/statistics/1445841/us-viewers-enjoying-social-video-the-most-by-gender/
InMobi. (2023). Share of viewers in the United States who enjoyed watching user generated and social video the most in 2023, by gender. Statista. Statista Inc.. Accessed: May 05, 2025. https://www.statista.com/statistics/1445841/us-viewers-enjoying-social-video-the-most-by-gender/
InMobi. "Share of Viewers in The United States Who Enjoyed Watching User Generated and Social Video The Most in 2023, by Gender." Statista, Statista Inc., 1 Aug 2023, https://www.statista.com/statistics/1445841/us-viewers-enjoying-social-video-the-most-by-gender/
InMobi, Share of viewers in the United States who enjoyed watching user generated and social video the most in 2023, by gender Statista, https://www.statista.com/statistics/1445841/us-viewers-enjoying-social-video-the-most-by-gender/ (last visited May 05, 2025)
Share of viewers in the United States who enjoyed watching user generated and social video the most in 2023, by gender [Graph], InMobi, August 1, 2023. [Online]. Available: https://www.statista.com/statistics/1445841/us-viewers-enjoying-social-video-the-most-by-gender/
Profit from additional features with an Employee Account
Please create an employee account to be able to mark statistics as favorites.
Then you can access your favorite statistics via the star in the header.
Profit from the additional features of your individual account
Currently, you are using a shared account. To use individual functions (e.g., mark statistics as favourites, set
statistic alerts) please log in with your personal account.
If you are an admin, please authenticate by logging in again.