The amount of water withdrawn for agricultural, industrial, and municipal purposes in Ghana totaled 1.46 billion cubic meters in 2020. Between 2016 and 2020, the volume remained the same, following an upward trend observed since 2000. The indicator measures water withdrawals across sectors.
Advertisement
Advertisement
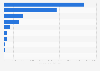
Total water withdrawal in Ghana from 2000 to 2020
(in billion cubic meters)
Characteristic
Volume in billion cubic meters
2020
1.46
2019
1.46
2018
1.46
2017
1.46
2016
1.46
2015
1.44
2014
1.36
2013
1.34
2012
1.32
2011
1.28
2010
1.25
2009
1.23
2008
1.2
00.250.50.7511.251.51.75
Add this content to your personal favorites. These can be accessed from the favorites menu in the main navigation.
You have no right to use this feature.
Make sure to contact us if you are interested in scientific citation.
You can upgrade your account to enable this functionality for all statistics.
This feature is not available with your current account.Request access
The release date is the date of access.
Figures have been rounded.
The source notes that the indicator measures the quantity of water withdrawn for agricultural, industrial and municipal purposes.
It adds that: "It includes water from primary renewable freshwater resources and secondary sources of water, as well as water from over-abstraction of renewable groundwater or withdrawal of fossil groundwater, direct use of agricultural drainage water and (treated) wastewater, and desalinated water. It does not include in stream uses, which are characterized by a very low net consumption rate, such as recreation, navigation, hydropower, inland capture fisheries, etc."
Learn more about how Statista can support your business.
FAO. (January 24, 2024). Total water withdrawal in Ghana from 2000 to 2020 (in billion cubic meters) [Graph]. In Statista. Retrieved July 14, 2025, from https://www.statista.com/statistics/1446778/annual-total-water-withdrawal-in-ghana/
FAO. "Total water withdrawal in Ghana from 2000 to 2020 (in billion cubic meters)." Chart. January 24, 2024. Statista. Accessed July 14, 2025. https://www.statista.com/statistics/1446778/annual-total-water-withdrawal-in-ghana/
FAO. (2024). Total water withdrawal in Ghana from 2000 to 2020 (in billion cubic meters). Statista. Statista Inc.. Accessed: July 14, 2025. https://www.statista.com/statistics/1446778/annual-total-water-withdrawal-in-ghana/
FAO. "Total Water Withdrawal in Ghana from 2000 to 2020 (in Billion Cubic Meters)." Statista, Statista Inc., 24 Jan 2024, https://www.statista.com/statistics/1446778/annual-total-water-withdrawal-in-ghana/
FAO, Total water withdrawal in Ghana from 2000 to 2020 (in billion cubic meters) Statista, https://www.statista.com/statistics/1446778/annual-total-water-withdrawal-in-ghana/ (last visited July 14, 2025)
Total water withdrawal in Ghana from 2000 to 2020 (in billion cubic meters) [Graph], FAO, January 24, 2024. [Online]. Available: https://www.statista.com/statistics/1446778/annual-total-water-withdrawal-in-ghana/
Advertisement
Profit from additional features with an Employee Account
Please create an employee account to be able to mark statistics as favorites.
Then you can access your favorite statistics via the star in the header.
Profit from the additional features of your individual account
Currently, you are using a shared account. To use individual functions (e.g., mark statistics as favourites, set
statistic alerts) please log in with your personal account.
If you are an admin, please authenticate by logging in again.