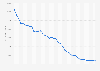
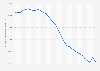
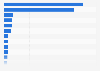
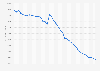
The state of California had the worst air quality in the United States from 2020 to 2023, with average fine particulate matter (PM2.5) concentrations of 12.7 micrograms per cubic meter (µg/m³). This was roughly three times higher than the average PM2.5 concentration in Hawaii, the U.S. state with the cleanest air. Some of the factors affecting air pollution in California include vehicle emissions, industrial processes, and wildfires.
Advertisement
Advertisement
Average fine particulate matter (PM2.5) pollution levels in the United States from 2020 to 2023, by state
(in micrograms per cubic meter)
Profit from the additional features of your individual account
Currently, you are using a shared account. To use individual functions (e.g., mark statistics as favourites, set
statistic alerts) please log in with your personal account.
If you are an admin, please authenticate by logging in again.
Learn more about how Statista can support your business.
America's Health Rankings. (December 2, 2024). Average fine particulate matter (PM2.5) pollution levels in the United States from 2020 to 2023, by state (in micrograms per cubic meter) [Graph]. In Statista. Retrieved June 13, 2025, from https://www.statista.com/statistics/1447785/united-states-pm25-air-pollution-exposure-by-state/
America's Health Rankings. "Average fine particulate matter (PM2.5) pollution levels in the United States from 2020 to 2023, by state (in micrograms per cubic meter)." Chart. December 2, 2024. Statista. Accessed June 13, 2025. https://www.statista.com/statistics/1447785/united-states-pm25-air-pollution-exposure-by-state/
America's Health Rankings. (2024). Average fine particulate matter (PM2.5) pollution levels in the United States from 2020 to 2023, by state (in micrograms per cubic meter). Statista. Statista Inc.. Accessed: June 13, 2025. https://www.statista.com/statistics/1447785/united-states-pm25-air-pollution-exposure-by-state/
America's Health Rankings. "Average Fine Particulate Matter (Pm2.5) Pollution Levels in The United States from 2020 to 2023, by State (in Micrograms per Cubic Meter)." Statista, Statista Inc., 2 Dec 2024, https://www.statista.com/statistics/1447785/united-states-pm25-air-pollution-exposure-by-state/
America's Health Rankings, Average fine particulate matter (PM2.5) pollution levels in the United States from 2020 to 2023, by state (in micrograms per cubic meter) Statista, https://www.statista.com/statistics/1447785/united-states-pm25-air-pollution-exposure-by-state/ (last visited June 13, 2025)
Average fine particulate matter (PM2.5) pollution levels in the United States from 2020 to 2023, by state (in micrograms per cubic meter) [Graph], America's Health Rankings, December 2, 2024. [Online]. Available: https://www.statista.com/statistics/1447785/united-states-pm25-air-pollution-exposure-by-state/