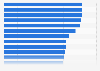
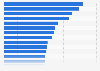
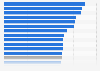
According to a U.S. hospital survey, the average nulliparous, term, singleton, vertex (NTSV) cesarean section rate was 25.3 percent in 2024*. This is the c-section rate for low-risk first-time mothers, which did not meet the national target of 23.6 percent**.
C-sections can be medically necessary, but involve risks such as infection, blood clots, extended recovery, and issues in subsequent pregnancies. The surgery may also impact neonatal health, increasing the chances of a NICU stay due to respiratory issues. Not to mention, c-section births also cost a lot more than vaginal delivery.
Even higher is the rate of c-section among all live births in the U.S., standing at 32.3 percent in 2023 (which includes mothers of higher risks such as giving birth to multiples or having hypertension or diabetes).
Advertisement
Advertisement
Average cesarean section rates among first-time low-risk mothers among reporting U.S. hospitals from 2015 to 2024
Over 1,700 hospitals provided data for the "2024 Leapfrog Hospital Survey"
Supplementary notes
*Nulliparous, Term, Singleton, Vertex (NTSV) Cesarean Birth rate: referring to C-sections for mothers with first-time pregnancies (nulliparous) that have reached at least 37 weeks of gestation (term) and have a single baby (singleton) in the head-down position (vertex). This measure exclusively examines the population of women least likely to need a C-section, offering a standardized way to compare rates at different hospitals. **National Healthy People 2030 target: NTSV cesarean birth rate: 23.6%.
Profit from the additional features of your individual account
Currently, you are using a shared account. To use individual functions (e.g., mark statistics as favourites, set
statistic alerts) please log in with your personal account.
If you are an admin, please authenticate by logging in again.
Learn more about how Statista can support your business.
The Leapfrog Group. (March 25, 2025). Average cesarean section rates among first-time low-risk mothers among reporting U.S. hospitals from 2015 to 2024 [Graph]. In Statista. Retrieved June 20, 2025, from https://www.statista.com/statistics/1448381/ntsv-c-section-rates-in-us-hospitals/
The Leapfrog Group. "Average cesarean section rates among first-time low-risk mothers among reporting U.S. hospitals from 2015 to 2024." Chart. March 25, 2025. Statista. Accessed June 20, 2025. https://www.statista.com/statistics/1448381/ntsv-c-section-rates-in-us-hospitals/
The Leapfrog Group. (2025). Average cesarean section rates among first-time low-risk mothers among reporting U.S. hospitals from 2015 to 2024. Statista. Statista Inc.. Accessed: June 20, 2025. https://www.statista.com/statistics/1448381/ntsv-c-section-rates-in-us-hospitals/
The Leapfrog Group. "Average Cesarean Section Rates among First-time Low-risk Mothers among Reporting U.S. Hospitals from 2015 to 2024." Statista, Statista Inc., 25 Mar 2025, https://www.statista.com/statistics/1448381/ntsv-c-section-rates-in-us-hospitals/
The Leapfrog Group, Average cesarean section rates among first-time low-risk mothers among reporting U.S. hospitals from 2015 to 2024 Statista, https://www.statista.com/statistics/1448381/ntsv-c-section-rates-in-us-hospitals/ (last visited June 20, 2025)
Average cesarean section rates among first-time low-risk mothers among reporting U.S. hospitals from 2015 to 2024 [Graph], The Leapfrog Group, March 25, 2025. [Online]. Available: https://www.statista.com/statistics/1448381/ntsv-c-section-rates-in-us-hospitals/