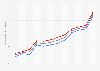
During the period analyzed, the highest number of female governors elected occurred in 2006 when three women governors were elected. After that year, female representation decreased, reaching 7.41 percent in 2022, or two female governors.
Advertisement
Advertisement
Share of Governors in Brazil from 2002 to 2022, by gender
Profit from the additional features of your individual account
Currently, you are using a shared account. To use individual functions (e.g., mark statistics as favourites, set
statistic alerts) please log in with your personal account.
If you are an admin, please authenticate by logging in again.
Learn more about how Statista can support your business.
Câmara dos Deputados (Brazil). (July 10, 2023). Share of Governors in Brazil from 2002 to 2022, by gender [Graph]. In Statista. Retrieved June 13, 2025, from https://www.statista.com/statistics/1453532/share-of-governors-in-brazil-by-gender/
Câmara dos Deputados (Brazil). "Share of Governors in Brazil from 2002 to 2022, by gender." Chart. July 10, 2023. Statista. Accessed June 13, 2025. https://www.statista.com/statistics/1453532/share-of-governors-in-brazil-by-gender/
Câmara dos Deputados (Brazil). (2023). Share of Governors in Brazil from 2002 to 2022, by gender. Statista. Statista Inc.. Accessed: June 13, 2025. https://www.statista.com/statistics/1453532/share-of-governors-in-brazil-by-gender/
Câmara dos Deputados (Brazil). "Share of Governors in Brazil from 2002 to 2022, by Gender." Statista, Statista Inc., 10 Jul 2023, https://www.statista.com/statistics/1453532/share-of-governors-in-brazil-by-gender/
Câmara dos Deputados (Brazil), Share of Governors in Brazil from 2002 to 2022, by gender Statista, https://www.statista.com/statistics/1453532/share-of-governors-in-brazil-by-gender/ (last visited June 13, 2025)
Share of Governors in Brazil from 2002 to 2022, by gender [Graph], Câmara dos Deputados (Brazil), July 10, 2023. [Online]. Available: https://www.statista.com/statistics/1453532/share-of-governors-in-brazil-by-gender/