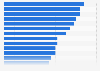
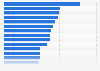
In 2024, approximately 23 percent of the households in the United States lived in energy poverty. The U.S. state with the highest energy poverty rate was Mississippi, where 30 percent of the resident families were unable to pay the energy bill.
U.S. families who struggle to maintain a safe temperature in the house can apply for the Low Income Home Energy Assistance Program (LIHEAP), which aided around six million households in the country in 2023.
Advertisement
Advertisement
Percentage of households living in energy poverty in the United States in 2024, by state
Profit from the additional features of your individual account
Currently, you are using a shared account. To use individual functions (e.g., mark statistics as favourites, set
statistic alerts) please log in with your personal account.
If you are an admin, please authenticate by logging in again.
Learn more about how Statista can support your business.
US Census Bureau. (February 12, 2025). Percentage of households living in energy poverty in the United States in 2024, by state [Graph]. In Statista. Retrieved June 26, 2025, from https://www.statista.com/statistics/1456832/us-households-unable-to-pay-energy-bill-share-by-state/
US Census Bureau. "Percentage of households living in energy poverty in the United States in 2024, by state." Chart. February 12, 2025. Statista. Accessed June 26, 2025. https://www.statista.com/statistics/1456832/us-households-unable-to-pay-energy-bill-share-by-state/
US Census Bureau. (2025). Percentage of households living in energy poverty in the United States in 2024, by state. Statista. Statista Inc.. Accessed: June 26, 2025. https://www.statista.com/statistics/1456832/us-households-unable-to-pay-energy-bill-share-by-state/
US Census Bureau. "Percentage of Households Living in Energy Poverty in The United States in 2024, by State." Statista, Statista Inc., 12 Feb 2025, https://www.statista.com/statistics/1456832/us-households-unable-to-pay-energy-bill-share-by-state/
US Census Bureau, Percentage of households living in energy poverty in the United States in 2024, by state Statista, https://www.statista.com/statistics/1456832/us-households-unable-to-pay-energy-bill-share-by-state/ (last visited June 26, 2025)
Percentage of households living in energy poverty in the United States in 2024, by state [Graph], US Census Bureau, February 12, 2025. [Online]. Available: https://www.statista.com/statistics/1456832/us-households-unable-to-pay-energy-bill-share-by-state/