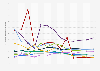
Alaska had the highest per capita carbon dioxide emissions from transportation in the United States in 2022. That year, the average resident in Alaska emitted 18.5 metric tons of carbon dioxide (tCO₂/cap). Wyoming followed, with approximately 12 tCO₂/cap. By comparison, Texas, which is the U.S. transportation sector's biggest polluter, produced roughly 7.3 tCO₂/cap in 2022.
Advertisement
Advertisement
Per capita energy-related carbon dioxide emissions from the transportation sector in the United States in 2022, by state
(in metric tons per person)
Figures were calculated by Statista using data provided by the source. Per capita emissions are based on total energy-related transportation CO₂ emissions divided by population in each state.
Energy-related CO₂ emissions refers to emissions released at the location where fossil fuels are consumed. Total state CO₂ emissions include emissions from direct fuel use across all sectors, as well as primary fuels consumed for electricity generation.
Profit from the additional features of your individual account
Currently, you are using a shared account. To use individual functions (e.g., mark statistics as favourites, set
statistic alerts) please log in with your personal account.
If you are an admin, please authenticate by logging in again.
Learn more about how Statista can support your business.
EIA, & Statista. (October 29, 2024). Per capita energy-related carbon dioxide emissions from the transportation sector in the United States in 2022, by state (in metric tons per person) [Graph]. In Statista. Retrieved July 07, 2025, from https://www.statista.com/statistics/1457210/us-transport-related-carbon-dioxide-emissions-per-capita/
EIA, und Statista. "Per capita energy-related carbon dioxide emissions from the transportation sector in the United States in 2022, by state (in metric tons per person)." Chart. October 29, 2024. Statista. Accessed July 07, 2025. https://www.statista.com/statistics/1457210/us-transport-related-carbon-dioxide-emissions-per-capita/
EIA, Statista. (2024). Per capita energy-related carbon dioxide emissions from the transportation sector in the United States in 2022, by state (in metric tons per person). Statista. Statista Inc.. Accessed: July 07, 2025. https://www.statista.com/statistics/1457210/us-transport-related-carbon-dioxide-emissions-per-capita/
EIA, and Statista. "Per Capita Energy-related Carbon Dioxide Emissions from The Transportation Sector in The United States in 2022, by State (in Metric Tons per Person)." Statista, Statista Inc., 29 Oct 2024, https://www.statista.com/statistics/1457210/us-transport-related-carbon-dioxide-emissions-per-capita/
EIA & Statista, Per capita energy-related carbon dioxide emissions from the transportation sector in the United States in 2022, by state (in metric tons per person) Statista, https://www.statista.com/statistics/1457210/us-transport-related-carbon-dioxide-emissions-per-capita/ (last visited July 07, 2025)
Per capita energy-related carbon dioxide emissions from the transportation sector in the United States in 2022, by state (in metric tons per person) [Graph], EIA, & Statista, October 29, 2024. [Online]. Available: https://www.statista.com/statistics/1457210/us-transport-related-carbon-dioxide-emissions-per-capita/