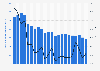
The U.S. oil and gas company Chevron is estimated to have produced almost 60 billion metric tons of carbon dioxide equivalent (GtCO₂e) between 1854 and 2023. This makes Chevron the investor-owned company with the highest historical GHG emissions produced during this period. Approximately six percent of Chevron's cumulative emissions during this time were produced in the seven years following the Paris Agreement (2016 to 2023).
ExxonMobil had the second-highest historical emissions among investor-owned companies, having produced over 55 GtCO₂e between 1854 and 2023.
Cumulative greenhouse gas (GHG) emissions of investor-owned companies worldwide from 1854 to 2023
(in million metric tons of carbon dioxide equivalent)
Total emissions include direct production-linked operational emissions (Scope 1) and emissions from the combustion of market products (Scope 3 category 11: Use of Sold Products).
Profit from the additional features of your individual account
Currently, you are using a shared account. To use individual functions (e.g., mark statistics as favourites, set
statistic alerts) please log in with your personal account.
If you are an admin, please authenticate by logging in again.
Learn more about how Statista can support your business.
InfluenceMap. (March 4, 2025). Cumulative greenhouse gas (GHG) emissions of investor-owned companies worldwide from 1854 to 2023 (in million metric tons of carbon dioxide equivalent) [Graph]. In Statista. Retrieved July 13, 2025, from https://www.statista.com/statistics/1463201/cumulative-ghg-of-investor-owned-companies-worldwide/
InfluenceMap. "Cumulative greenhouse gas (GHG) emissions of investor-owned companies worldwide from 1854 to 2023 (in million metric tons of carbon dioxide equivalent)." Chart. March 4, 2025. Statista. Accessed July 13, 2025. https://www.statista.com/statistics/1463201/cumulative-ghg-of-investor-owned-companies-worldwide/
InfluenceMap. (2025). Cumulative greenhouse gas (GHG) emissions of investor-owned companies worldwide from 1854 to 2023 (in million metric tons of carbon dioxide equivalent). Statista. Statista Inc.. Accessed: July 13, 2025. https://www.statista.com/statistics/1463201/cumulative-ghg-of-investor-owned-companies-worldwide/
InfluenceMap. "Cumulative Greenhouse Gas (Ghg) Emissions of Investor-owned Companies Worldwide from 1854 to 2023 (in Million Metric Tons of Carbon Dioxide Equivalent)." Statista, Statista Inc., 4 Mar 2025, https://www.statista.com/statistics/1463201/cumulative-ghg-of-investor-owned-companies-worldwide/
InfluenceMap, Cumulative greenhouse gas (GHG) emissions of investor-owned companies worldwide from 1854 to 2023 (in million metric tons of carbon dioxide equivalent) Statista, https://www.statista.com/statistics/1463201/cumulative-ghg-of-investor-owned-companies-worldwide/ (last visited July 13, 2025)
Cumulative greenhouse gas (GHG) emissions of investor-owned companies worldwide from 1854 to 2023 (in million metric tons of carbon dioxide equivalent) [Graph], InfluenceMap, March 4, 2025. [Online]. Available: https://www.statista.com/statistics/1463201/cumulative-ghg-of-investor-owned-companies-worldwide/