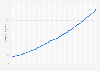
The price of carbon under the California Cap-and-Trade program (California CaT) was 38.6 U.S. dollars per metric ton (USD/tCO₂e) on April 1, 2024. By comparison, carbon permits on April 1, 2021 were less than 20 USD/tCO₂e. The California CaT covers the transportation, buildings, industry, and power sectors, and is a key element of California's greenhouse gas emissions reductions strategy.
Carbon prices trends for the California Cap-and-Trade program on April 1, from 2012 to 2024
(in U.S. dollars per metric ton of CO₂ equivalent)
Adjust the presentation of the statistic and data points.
Share the statistic on social media channels or embed the statistic in your
website using "Embed Code", where available.
Cite this statistic and select one of the following formats: APA, Chicago, Harvard, MLA & Bluebook.
Print the statistic including description and metadata.
Chart type
Carbon prices trends for the California Cap-and-Trade program on April 1, from 2012 to 2024
Share this statistic
You have no right to use this feature.
Make sure to contact us if you are interested in scientific citation.
You can upgrade your account to enable this functionality for all statistics.
This feature is not available with your current account.Request access
Learn more about how Statista can support your business.
World Bank. (May 20, 2024). Carbon prices trends for the California Cap-and-Trade program on April 1, from 2012 to 2024 (in U.S. dollars per metric ton of CO₂ equivalent) [Graph]. In Statista. Retrieved May 06, 2025, from https://www.statista.com/statistics/1471086/carbon-prices-for-california-cat-program/
World Bank. "Carbon prices trends for the California Cap-and-Trade program on April 1, from 2012 to 2024 (in U.S. dollars per metric ton of CO₂ equivalent)." Chart. May 20, 2024. Statista. Accessed May 06, 2025. https://www.statista.com/statistics/1471086/carbon-prices-for-california-cat-program/
World Bank. (2024). Carbon prices trends for the California Cap-and-Trade program on April 1, from 2012 to 2024 (in U.S. dollars per metric ton of CO₂ equivalent). Statista. Statista Inc.. Accessed: May 06, 2025. https://www.statista.com/statistics/1471086/carbon-prices-for-california-cat-program/
World Bank. "Carbon Prices Trends for The California Cap-and-trade Program on April 1, from 2012 to 2024 (in U.S. Dollars per Metric Ton of Co₂ Equivalent)." Statista, Statista Inc., 20 May 2024, https://www.statista.com/statistics/1471086/carbon-prices-for-california-cat-program/
World Bank, Carbon prices trends for the California Cap-and-Trade program on April 1, from 2012 to 2024 (in U.S. dollars per metric ton of CO₂ equivalent) Statista, https://www.statista.com/statistics/1471086/carbon-prices-for-california-cat-program/ (last visited May 06, 2025)
Carbon prices trends for the California Cap-and-Trade program on April 1, from 2012 to 2024 (in U.S. dollars per metric ton of CO₂ equivalent) [Graph], World Bank, May 20, 2024. [Online]. Available: https://www.statista.com/statistics/1471086/carbon-prices-for-california-cat-program/
Profit from additional features with an Employee Account
Please create an employee account to be able to mark statistics as favorites.
Then you can access your favorite statistics via the star in the header.
Profit from the additional features of your individual account
Currently, you are using a shared account. To use individual functions (e.g., mark statistics as favourites, set
statistic alerts) please log in with your personal account.
If you are an admin, please authenticate by logging in again.