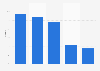
In 2023, millennials (consumers aged 27 to 42) spent an average of 2,670 U.S. dollars on beauty products. This is higher than the average yearly spend of beauty product consumers from all other age groups in the United States.
Advertisement
Advertisement
Average yearly spend on beauty products in the United States in 2023, by generation
(in U.S. dollars)
Characteristic
Average yearly spend in U.S. dollars
Millennials (27 to 42 years old)
2,670
Gen Zers (18 to 26 years old)
2,048
Gen Xers (43 to 58 years old)
1,517
Baby Boomers (59 to 77 years old)
494
All generations
1,754
05001,0001,5002,0002,5003,000
Add this content to your personal favorites. These can be accessed from the favorites menu in the main navigation.
You have no right to use this feature.
Make sure to contact us if you are interested in scientific citation.
You can upgrade your account to enable this functionality for all statistics.
This feature is not available with your current account.Request access
Learn more about how Statista can support your business.
LendingTree. (August 27, 2023). Average yearly spend on beauty products in the United States in 2023, by generation (in U.S. dollars) [Graph]. In Statista. Retrieved June 28, 2025, from https://www.statista.com/statistics/1471315/average-yearly-spend-on-beauty-products-us-by-age-group/
LendingTree. "Average yearly spend on beauty products in the United States in 2023, by generation (in U.S. dollars)." Chart. August 27, 2023. Statista. Accessed June 28, 2025. https://www.statista.com/statistics/1471315/average-yearly-spend-on-beauty-products-us-by-age-group/
LendingTree. (2023). Average yearly spend on beauty products in the United States in 2023, by generation (in U.S. dollars). Statista. Statista Inc.. Accessed: June 28, 2025. https://www.statista.com/statistics/1471315/average-yearly-spend-on-beauty-products-us-by-age-group/
LendingTree. "Average Yearly Spend on Beauty Products in The United States in 2023, by Generation (in U.S. Dollars)." Statista, Statista Inc., 27 Aug 2023, https://www.statista.com/statistics/1471315/average-yearly-spend-on-beauty-products-us-by-age-group/
LendingTree, Average yearly spend on beauty products in the United States in 2023, by generation (in U.S. dollars) Statista, https://www.statista.com/statistics/1471315/average-yearly-spend-on-beauty-products-us-by-age-group/ (last visited June 28, 2025)
Average yearly spend on beauty products in the United States in 2023, by generation (in U.S. dollars) [Graph], LendingTree, August 27, 2023. [Online]. Available: https://www.statista.com/statistics/1471315/average-yearly-spend-on-beauty-products-us-by-age-group/
Advertisement
Profit from additional features with an Employee Account
Please create an employee account to be able to mark statistics as favorites.
Then you can access your favorite statistics via the star in the header.
Profit from the additional features of your individual account
Currently, you are using a shared account. To use individual functions (e.g., mark statistics as favourites, set
statistic alerts) please log in with your personal account.
If you are an admin, please authenticate by logging in again.