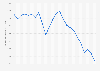
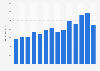
The total climate cost of the first two years of the Russian invasion of Ukraine is estimated to be at least *** million metric tons of carbon dioxide equivalent (MtCO₂e). Roughly a third of these emissions are attributed to future reconstruction efforts, due to the large amounts of highly carbon-intensive concrete and steel needed to rebuild damaged civilian infrastructure. Meanwhile, emissions from direct warfare activities like fossil fuel consumption from troops and the use of ammunition caused roughly ** percent of total emissions between February 2022 and February 2024.
Distribution of total greenhouse gas emissions during the Russia-Ukraine war from February 2022 to February 2024, by sector
(in million metric tons of carbon dioxide equivalent)
Profit from the additional features of your individual account
Currently, you are using a shared account. To use individual functions (e.g., mark statistics as favourites, set
statistic alerts) please log in with your personal account.
If you are an admin, please authenticate by logging in again.
Learn more about how Statista can support your business.
Centre for Environmental Initiatives. (June 12, 2024). Distribution of total greenhouse gas emissions during the Russia-Ukraine war from February 2022 to February 2024, by sector (in million metric tons of carbon dioxide equivalent) [Graph]. In Statista. Retrieved July 13, 2025, from https://www.statista.com/statistics/1473627/share-of-ghg-emissions-from-russia-ukraine-war-by-sector/
Centre for Environmental Initiatives. "Distribution of total greenhouse gas emissions during the Russia-Ukraine war from February 2022 to February 2024, by sector (in million metric tons of carbon dioxide equivalent)." Chart. June 12, 2024. Statista. Accessed July 13, 2025. https://www.statista.com/statistics/1473627/share-of-ghg-emissions-from-russia-ukraine-war-by-sector/
Centre for Environmental Initiatives. (2024). Distribution of total greenhouse gas emissions during the Russia-Ukraine war from February 2022 to February 2024, by sector (in million metric tons of carbon dioxide equivalent). Statista. Statista Inc.. Accessed: July 13, 2025. https://www.statista.com/statistics/1473627/share-of-ghg-emissions-from-russia-ukraine-war-by-sector/
Centre for Environmental Initiatives. "Distribution of Total Greenhouse Gas Emissions during The Russia-ukraine War from February 2022 to February 2024, by Sector (in Million Metric Tons of Carbon Dioxide Equivalent)." Statista, Statista Inc., 12 Jun 2024, https://www.statista.com/statistics/1473627/share-of-ghg-emissions-from-russia-ukraine-war-by-sector/
Centre for Environmental Initiatives, Distribution of total greenhouse gas emissions during the Russia-Ukraine war from February 2022 to February 2024, by sector (in million metric tons of carbon dioxide equivalent) Statista, https://www.statista.com/statistics/1473627/share-of-ghg-emissions-from-russia-ukraine-war-by-sector/ (last visited July 13, 2025)
Distribution of total greenhouse gas emissions during the Russia-Ukraine war from February 2022 to February 2024, by sector (in million metric tons of carbon dioxide equivalent) [Graph], Centre for Environmental Initiatives, June 12, 2024. [Online]. Available: https://www.statista.com/statistics/1473627/share-of-ghg-emissions-from-russia-ukraine-war-by-sector/