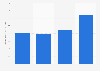
From 2007 to 2022, Lima's GDP consistently increased, achieving its highest level at *** billion Peruvian Soles. Only in 2020, the GDP of the Peruvian capital suffered a decline, with the value falling to *** billion Soles.
Profit from the additional features of your individual account
Currently, you are using a shared account. To use individual functions (e.g., mark statistics as favourites, set
statistic alerts) please log in with your personal account.
If you are an admin, please authenticate by logging in again.
Learn more about how Statista can support your business.
INEI (Peru). (December 13, 2024). Annual GDP at constant prices of metropolitan Lima from 2007 to 2023 (in billions of Peruvian Soles) [Graph]. In Statista. Retrieved July 13, 2025, from https://www.statista.com/statistics/1473837/gdp-of-lima/
INEI (Peru). "Annual GDP at constant prices of metropolitan Lima from 2007 to 2023 (in billions of Peruvian Soles)." Chart. December 13, 2024. Statista. Accessed July 13, 2025. https://www.statista.com/statistics/1473837/gdp-of-lima/
INEI (Peru). (2024). Annual GDP at constant prices of metropolitan Lima from 2007 to 2023 (in billions of Peruvian Soles). Statista. Statista Inc.. Accessed: July 13, 2025. https://www.statista.com/statistics/1473837/gdp-of-lima/
INEI (Peru). "Annual Gdp at Constant Prices of Metropolitan Lima from 2007 to 2023 (in Billions of Peruvian Soles)." Statista, Statista Inc., 13 Dec 2024, https://www.statista.com/statistics/1473837/gdp-of-lima/
INEI (Peru), Annual GDP at constant prices of metropolitan Lima from 2007 to 2023 (in billions of Peruvian Soles) Statista, https://www.statista.com/statistics/1473837/gdp-of-lima/ (last visited July 13, 2025)
Annual GDP at constant prices of metropolitan Lima from 2007 to 2023 (in billions of Peruvian Soles) [Graph], INEI (Peru), December 13, 2024. [Online]. Available: https://www.statista.com/statistics/1473837/gdp-of-lima/