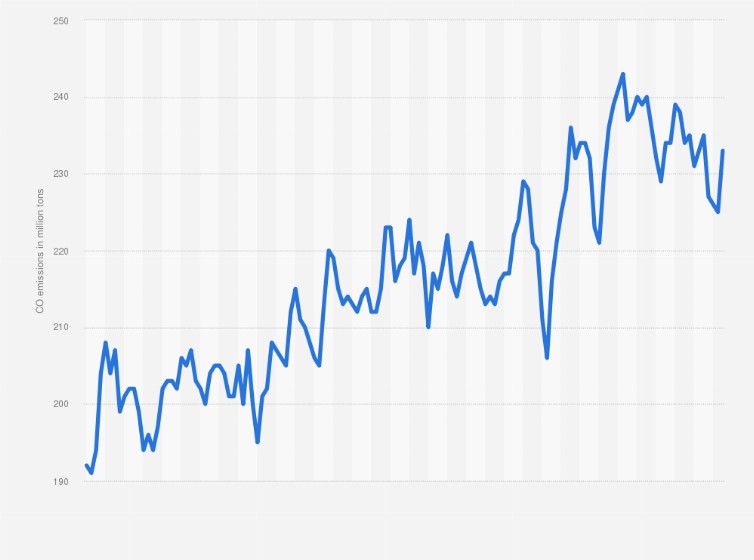
Carbon dioxide emissions from the world's dry bulk and general cargo fleet have risen more than 21 percent since 2012. Emissions have seen a growing trend, with a noticeable decline from September 2019 to March 2020. During this time frame, emissions peaked in June 2021, with 243 million tons.
Annualized monthly carbon dioxide emissions from the world's dry bulk and general cargo fleets from 2012 to 2023
(in million tons)
Adjust the presentation of the statistic and data points.
Share the statistic on social media channels or embed the statistic in your
website using "Embed Code", where available.
Cite this statistic and select one of the following formats: APA, Chicago, Harvard, MLA & Bluebook.
Print the statistic including description and metadata.
Chart type
Annualized monthly carbon dioxide emissions from the world's dry bulk and general cargo fleets from 2012 to 2023
Share this statistic
You have no right to use this feature.
Make sure to contact us if you are interested in scientific citation.
You can upgrade your account to enable this functionality for all statistics.
This feature is not available with your current account.Request access
Learn more about how Statista can support your business.
UNCTAD. (September 27, 2023). Annualized monthly carbon dioxide emissions from the world's dry bulk and general cargo fleets from 2012 to 2023 (in million tons) [Graph]. In Statista. Retrieved May 16, 2025, from https://www.statista.com/statistics/1480858/monthly-shipping-emissions-worldwide-dry-bullk-general-cargo/
UNCTAD. "Annualized monthly carbon dioxide emissions from the world's dry bulk and general cargo fleets from 2012 to 2023 (in million tons)." Chart. September 27, 2023. Statista. Accessed May 16, 2025. https://www.statista.com/statistics/1480858/monthly-shipping-emissions-worldwide-dry-bullk-general-cargo/
UNCTAD. (2023). Annualized monthly carbon dioxide emissions from the world's dry bulk and general cargo fleets from 2012 to 2023 (in million tons). Statista. Statista Inc.. Accessed: May 16, 2025. https://www.statista.com/statistics/1480858/monthly-shipping-emissions-worldwide-dry-bullk-general-cargo/
UNCTAD. "Annualized Monthly Carbon Dioxide Emissions from The World's Dry Bulk and General Cargo Fleets from 2012 to 2023 (in Million Tons)." Statista, Statista Inc., 27 Sep 2023, https://www.statista.com/statistics/1480858/monthly-shipping-emissions-worldwide-dry-bullk-general-cargo/
UNCTAD, Annualized monthly carbon dioxide emissions from the world's dry bulk and general cargo fleets from 2012 to 2023 (in million tons) Statista, https://www.statista.com/statistics/1480858/monthly-shipping-emissions-worldwide-dry-bullk-general-cargo/ (last visited May 16, 2025)
Annualized monthly carbon dioxide emissions from the world's dry bulk and general cargo fleets from 2012 to 2023 (in million tons) [Graph], UNCTAD, September 27, 2023. [Online]. Available: https://www.statista.com/statistics/1480858/monthly-shipping-emissions-worldwide-dry-bullk-general-cargo/
Profit from additional features with an Employee Account
Please create an employee account to be able to mark statistics as favorites.
Then you can access your favorite statistics via the star in the header.
Profit from the additional features of your individual account
Currently, you are using a shared account. To use individual functions (e.g., mark statistics as favourites, set
statistic alerts) please log in with your personal account.
If you are an admin, please authenticate by logging in again.